Customer segmentation Redefining rich—the geographic dimension of the affluent

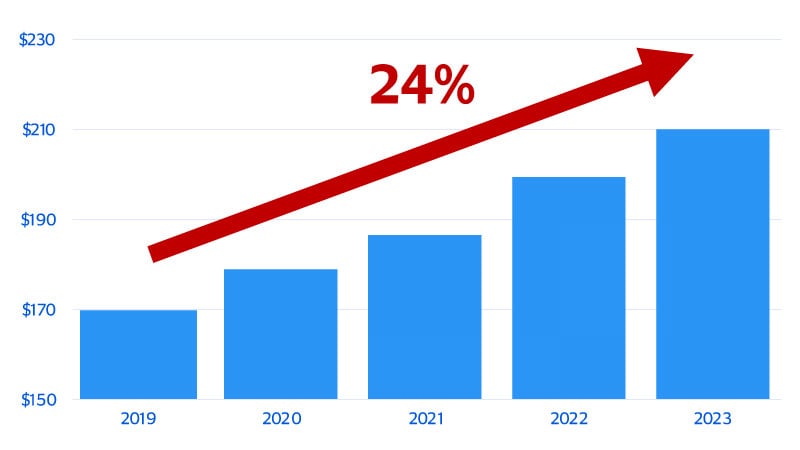
November 2025 – Thanks to a booming stock market, strong real estate values and a resilient dollar, every day in 2024¹ an estimated 1,000 Americans achieved a net worth—defined as the total value of assets minus debts—of $1 million. This surge pushed the number of millionaires in the U.S. to more than 23 million in 2025, or 40 percent of the global total.² But times have changed, and so too has the purchasing power of $1 million. The surge in asset prices and subsequent rise in everyday millionaires raised the bar for what it means to be affluent, which we define not by a static dollar figure, but by entry into the top 10 percent of U.S. households. And that entry threshold has risen sharply in recent years.
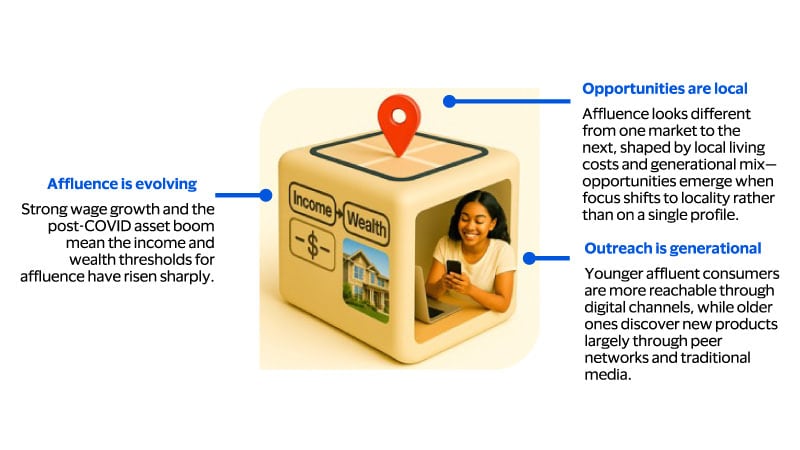
According to new analysis from Visa Business and Economic Insights (VBEI), about 12.2 million U.S. households qualify as affluent, with an annual income of $210,000 or higher or a net worth of at least $1.8 million placing them above 90 percent of all U.S. households.³ While the surge in asset prices has sharply elevated the net worth required to reach this tier, persistent labor shortages—driven by retiring baby boomers and slower immigration—have fueled strong income growth and pushed the income threshold for affluence higher. But when it comes to being affluent, where you live can be just as important as what you earn and what you’re worth. In the wake of historically high inflation, significant geographic differences in the cost of living have emerged—reshaping the landscape of affluence across the country. Our analysis finds that these and other factors influence not only where the affluent live, but also how affluence is distributed across generations and how generational differences shape spending patterns. These insights suggest that adopting a more nuanced, localized, and age-aware approach can help issuers and merchants better compete for the evolving segment of affluent households.
Earning your way into the ranks of the affluent costs a lot more now
Minimum household income needed to qualify for the top 10 percent of U.S. households (thousands of dollars)
The geographic dimension and the cost of living
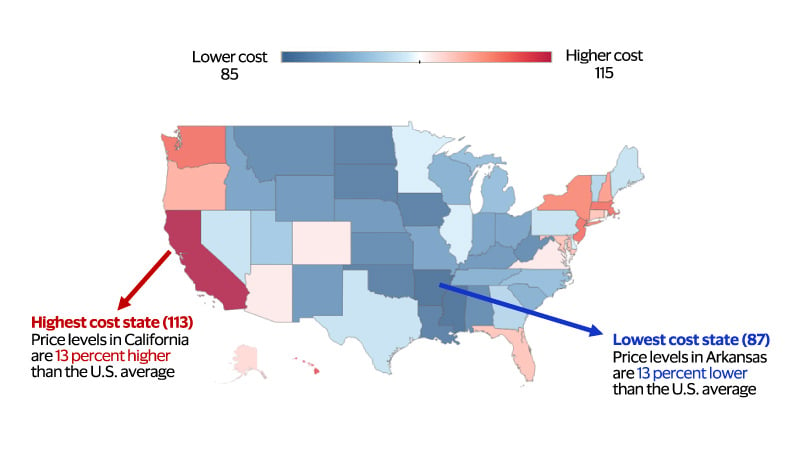
Cost of living varies significantly across the U.S.
Cost of living in each state relative to the U.S. (U.S. average = 100)
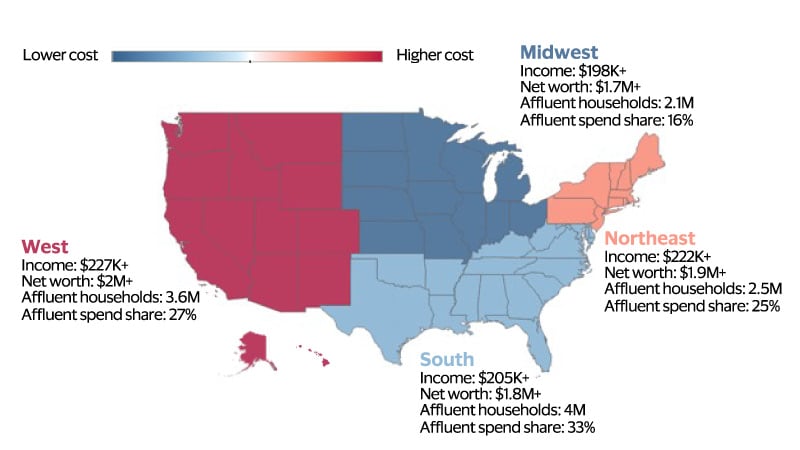
Location, location, location
Minimum income and net worth thresholds to meet the definition of affluent, by region
U.S. average = $210,000 in income and $1.8 million in net worth
The affluent spend a lot, but who’s doing the spending?
Affluent households in the U.S. spend nearly three times more than their non-affluent counterparts.* That’s not surprising—wealthier consumers have more disposable income and can tap financial assets for spending. But the real story lies in who among the affluent are doing the spending. Baby boomers make up just 12 percent of affluent households, yet they account for 42 percent of affluent spending.* This outsized influence stems from one key fact: affluent boomers control the bulk of their generation’s $85 trillion-plus in wealth,⁵ and they’re primarily spending it through the wealth effect—unlike the average boomer, who is more likely to spend down their wealth as they age and as markets fluctuate.
We previously explored how income constraints and the need for long-term planning will limit retiree spending. But affluent boomers are a different story. They spend less out of necessity and more on discretionary pursuits, typically funded by investment income, dividends, and rental flows. While boomers lead in affluent spending, Gen X dominates in household representation, comprising 57 percent of affluent households and contributing 33 percent of affluent spending. But their financial picture is more complex. Many Gen Xers are burdened by mortgage and student loan debt while also caring for children, aging parents, or both—a juggling act common among those who belong to the “sandwich generation.” Together, boomers and Gen X drive three-quarters of affluent spending and make up most affluent households. It’s no coincidence, then, that the South—home to a higher share of older affluent households—leads the nation in both affluent spending and household share.
How is affluent spending different?
Life’s spending milestones bring consumers together
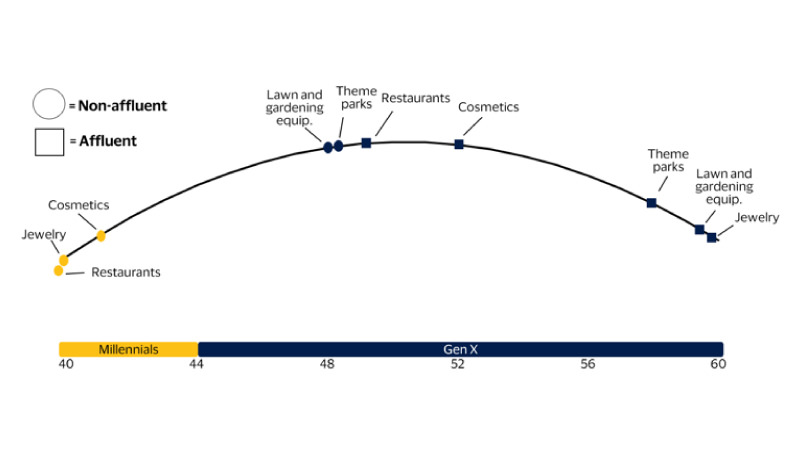
When it comes to some of life’s milestones, the affluent spend like everyone else
Peak credit card spending for select categories averaged over 12 months (July 2024 to July 2025)
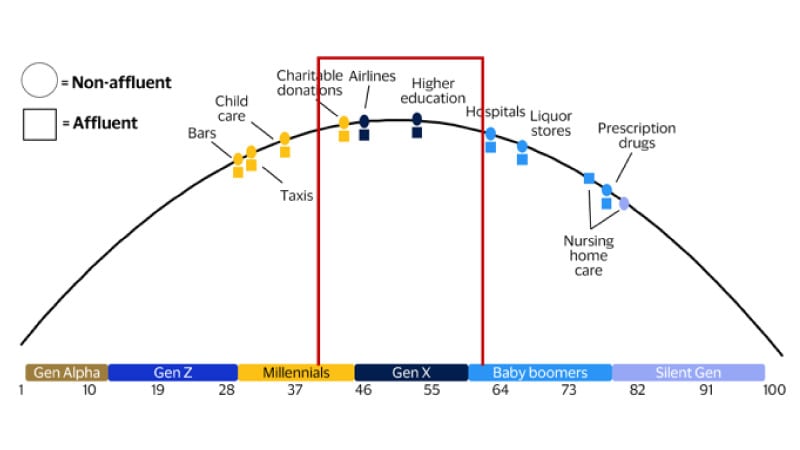
When it comes to life’s small pleasures, the affluent spend more for longer
Peak credit card spending for select categories averaged over 12 months (July 2024 to July 2025)
Competing for the affluent doesn’t have to be a zero-sum game
The new dimension—location—unlocks more opportunities to compete for affluent consumers
* View these charts in the full PDF report.
Footnotes
- Visa Business and Economic Insights and UBS 2025 Global Wealth Report
- Visa Business and Economic Insights and UBS 2025 Global Wealth Report
- Visa Business and Economic Insights, U.S. Department of Labor and Federal Reserve Board
- To estimate regional affluence benchmarks, we adjusted the national income and net worth benchmarks using state-level price parities, then averaged them—weighted by each state’s share of affluent households. Finally, we combined census household data with VisaNet transaction insights to estimate how affluent households and spending are distributed across generations within each region.
- Visa Business and Economic Insights and Federal Reserve Board
Forward-Looking Statements
This report may contain forward-looking statements within the meaning of the U.S. Private Securities Litigation Reform Act of 1995. These statements are generally identified by words such as “outlook”, “forecast”, “projected”, “could”, “expects”, “will” and other similar expressions. Examples of such forward-looking statements include, but are not limited to, statements we make about Visa’s business, economic outlooks, population expansion and analyses. All statements other than statements of historical fact could be forward-looking statements, which speak only as of the date they are made, are not guarantees of future performance and are subject to certain risks, uncertainties and other factors, many of which are beyond our control and are difficult to predict. We describe risks and uncertainties that could cause actual results to differ materially from those expressed in, or implied by, any of these forward-looking statements in our filings with the SEC. Except as required by law, we do not intend to update or revise any forward-looking statements as a result of new information, future events or otherwise.
Disclaimers
The views, opinions, and/or estimates, as the case may be (“views”), expressed herein are those of the Visa Business and Economic Insights team and do not necessarily reflect those of Visa executive management or other Visa employees and affiliates. This presentation and content, including estimated economic forecasts, statistics, and indexes are intended for informational purposes only and should not be relied upon for operational, marketing, legal, technical, tax, financial or other advice and do not in any way reflect actual or forecasted Visa operational or financial performance. Visa neither makes any warranty or representation as to the completeness or accuracy of the views contained herein, nor assumes any liability or responsibility that may result from reliance on such views. These views are often based on current market conditions and are subject to change without notice.
Visa’s team of economists provide business and economic insights with up-to-date analysis on the latest trends in consumer spending and payments. Sign up today to receive their regular updates automatically via email.