Going down south: the emergence of a regional powerhouse

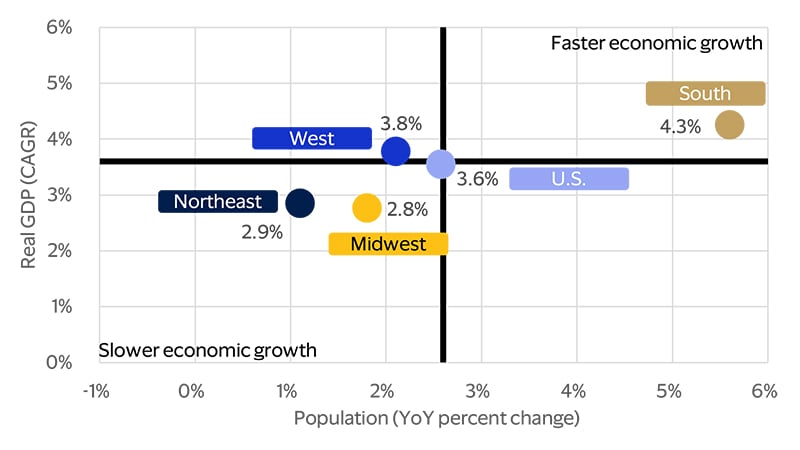
May 2025 – What do eight of the 15 fastest-growing cities in the United States have in common? They are all located in Texas or Florida—two of the nation’s fastest-growing states that form the core engine of the booming Southern economy.¹ According to new analysis from Visa Business and Economic Insights, the South’s population has surged 5.6 percent—or more than 7 million people—since the pandemic. Where people go, economic growth follows. The South’s GDP has increased at a rapid average annual rate of 4.3 percent from 2020 to 2024, compared to 3.6 percent growth for the U.S. economy. The region’s share of national GDP has risen from 34 percent in 2019 to 35 percent in 2024—a far higher share than other regions. In fact, the combined GDP of Texas and Florida alone is more than two-thirds the size of the Northeast and Midwest economies, respectively, and more than 50 percent the size of the West.
While the South’s large population and economic footprint are nothing new and partly a reflection of its size—the region encompasses 16 states, plus the District of Columbia—it has grown rapidly over the past several years and the factors driving this growth extend beyond post-pandemic trends. Instead, they are rooted in structural shifts that will provide long-term durability to the region’s positive outlook. Our analysis finds that years of strong in-migration, a low tax burden and more affordable housing have not only enabled greater discretionary spending but have also evolved the region into a more diversified economy that is well-positioned for robust consumption growth in the future. We expect consumer spending in the South to continue outpacing national consumer spending through this year and 2026.
The South’s population and GDP have grown rapidly since 2020
Population growth v. real GDP growth: 2020 to 2024 (YoY percent change and CAGR*)
If you build it, they will come
Stories of Californians relocating to Texas and New Yorkers moving to Florida became widespread following the pandemic, and for good reason. Soaring housing costs and the sudden surge in remote and hybrid work fueled a population outflow from expensive coastal regions to states with a more affordable cost of living.
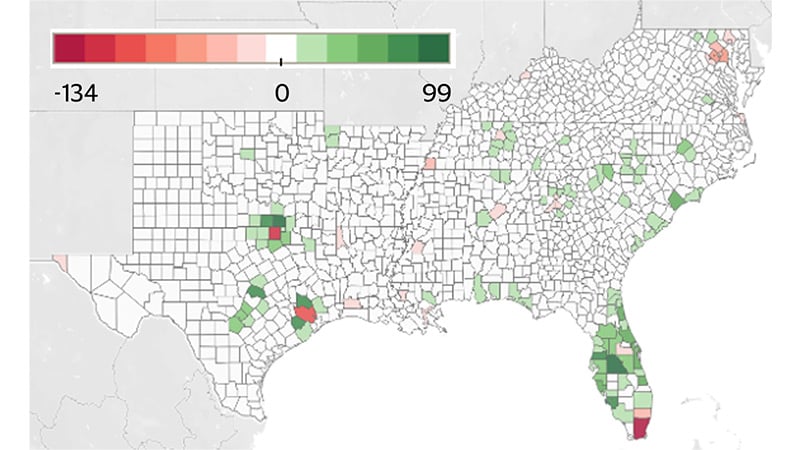
The South, free from the cold and dreary winters of the Northeast, the high living costs of the West Coast, and boasting a more dynamic economy than the Midwest, naturally benefited from these migration trends. In fact, it is the only region that has benefited from domestic migration from other U.S. regions since the pandemic (see figure below). Although the map shows little green, the South has gained nearly half a million domestic migrants since 2020.² The same chart for other regions would reveal many counties in red, indicating negative net domestic migration (neutral counties are shown in white to represent exiting households replaced by those moving in). Nonetheless, international migration underlies most of the region’s growth.* Since 2020, net international migration to the South has totaled 2.4 million.³ While this growth was partially due to relaxed travel restrictions following pandemic lockdowns, the South’s population rose an average of 1 percent annually from 2009 to 2019, beating the overall U.S. and all other regions.⁴ Strong domestic and international migration drove much of that growth.
The South is the only region benefiting from domestic migration
Net domestic migration (percent change, 2020-2023)
Affordability and a lower cost of living start and end with housing, which has been and continues to be the primary driver of in-migration to the South.
The rapidly growing and evolving Southern economy
There is a strong link between housing availability and economic development. Lower housing costs have drawn more people and an increasing labor force to the South, which in turn has attracted more business investment and stronger economic growth.
When companies consider where to relocate or expand, access to a growing and diverse labor supply is a top priority, and labor has increasingly headed south. From 2019 to 2024, the South’s labor force increased 6.4 percent compared to 2.8 percent nationally.¹⁰ Not surprisingly, job growth in the South also outpaced the nation, rising 10 percent during the same period compared to 4.7 percent nationwide. In fact, 78 percent of all jobs added during the past five years were in the South.¹¹ The region’s strong job market has accelerated economic growth. Prior to the pandemic, the West was driving a disproportionate share of U.S. economic growth compared to other regions. In recent years, however, the Southern economy has played a dominate role.* While we expect the West to recover, our forecast calls for the South to remain the top performing region through 2026.
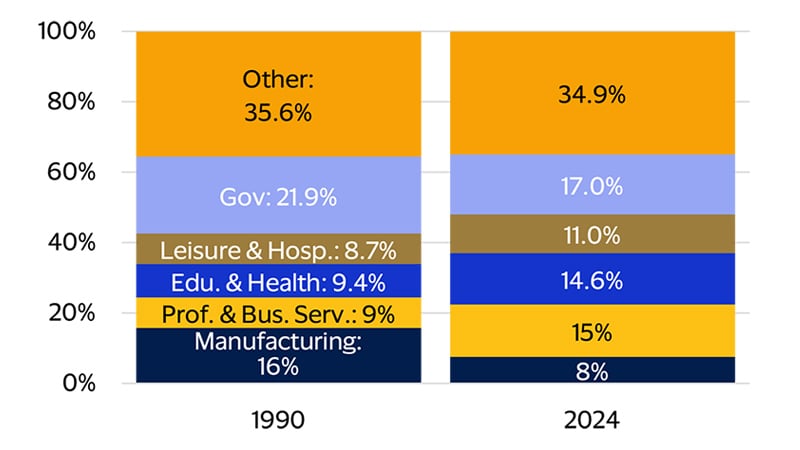
Strong growth has been accompanied by a significant evolution in the Southern economy. In 1990, manufacturing accounted for 16 percent of the region’s total employment, but by 2024, that proportion had been reduced by half (see figure below). Similarly, government employment, which includes K-12 teachers, decreased from 22 percent to 17 percent. Higher-skilled and higher-paying job sectors have expanded. Professional and business services, encompassing jobs in fields like consulting, legal services and software engineering, has seen strong employment growth. The share of employees in education and healthcare has also increased.
The South employs more highly skilled workers
The South’s employment composition by industry in 1990 vs. 2024 (percent share)
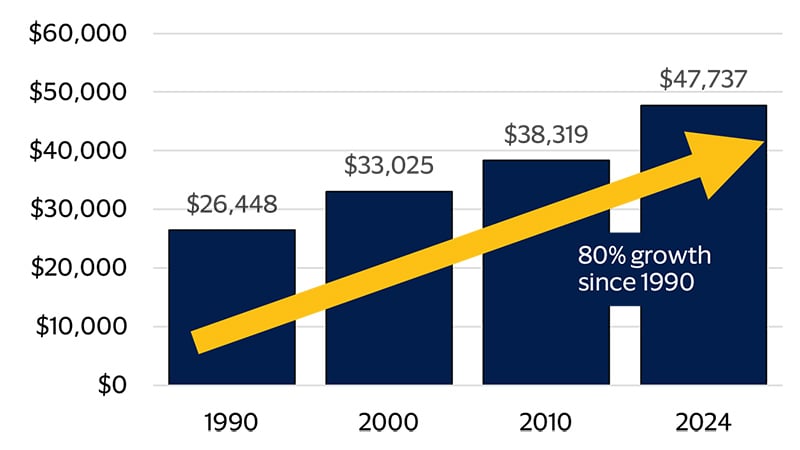
Southern purchasing power: Income growth meets low living costs
Real per capita income surges as the composition of employment evolves
Real per capita income for the South (2017 dollars)
The South leads the nation in consumer spending
With ample employment, income and labor force growth, plus a relatively low tax burden compared to the national average, the South leads the nation in consumer spending.
From 2022 to 2024, nominal consumer spending growth in the South averaged 7.4 percent YoY, which is 0.2 percentage points higher than the national average and higher than any other region.* This robust spending occurred even though per capita income growth lagged the U.S. during the same period. With 39 percent of Americans living in the South—the largest share of any region—it is also home to the nation’s largest consumer base.¹⁶ The South accounts for 36 percent of all consumer spending in the U.S., which is 11 percentage points above the next highest region, the West.¹⁷
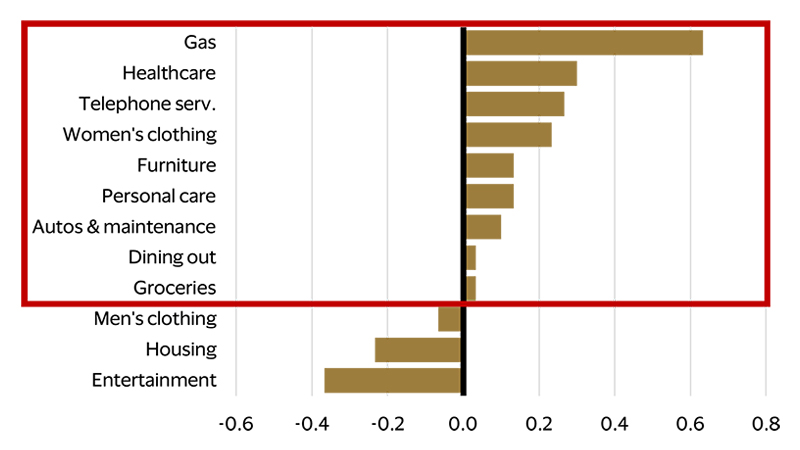
The South’s lower cost of living enables more discretionary consumer spending.
Although incomes and income growth are lower in the South compared to the nationwide average, lower taxes and an overall lower cost of living bolster purchasing power and enable greater spending on many discretionary items. Housing is more affordable in the South and so housing costs in the region consume a smaller share of after-tax or disposable income compared to the national average. This frees up income for spending elsewhere (see figure below). For example, Southerners spend a greater share of their disposable income on furniture, which also reflects the fact that 67 percent of households in the region are homeowners, compared to 65 percent nationally.
Lower taxes allow for spending in other categories
Differences in spending shares for selected categories relative to other regions (percentage points)
Southern growth shines, but there are consumer risks
Some of the same factors driving strong growth in the region have also introduced challenges and vulnerabilities, raising the specter of consumer risks.
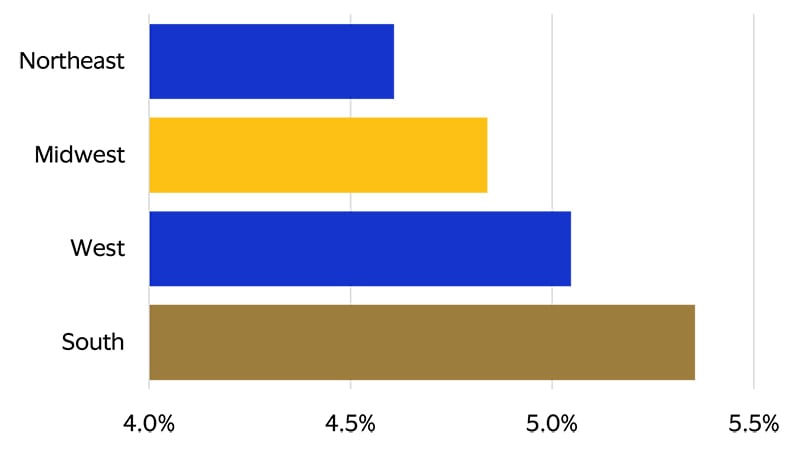
The South’s lower cost of living doesn’t shield it from the effects of inflation, and the region has experienced higher inflation over the past several years (see figure below).
The South has been hit hard by inflation pressures
Avg. inflation by region, 2022-2024 (YoY percent change)
The South’s explosive growth has increased demand for housing, leading to rapid home price growth. From 2020 to 2024, the median sale price of single-family homes in the South increased at an annualized rate of 9 percent, outpacing the national rate of 8 percent.²⁰ Additionally, Southerners, who allocate a larger portion of their disposable income to gasoline, were disproportionally impacted by the spike in gas prices in 2022. The rising cost of healthcare, which consumes a larger share of disposable income in the South, also contributes to inflation pressures in the region.
Because poverty rates are higher in the South and incomes are lower, it follows that many Southern consumers are especially sensitive to high inflation.²¹ This vulnerability is evident when looking at the ratio of debt payments to disposable income. Despite lower housing costs, debt burdens are high in the South and second only to the West.* Inflation raises the cost of living, leading to financial pressure for consumers and potentially increasing debt balances and credit risk. In fact, the severe delinquency rates for credit cards, mortgages and auto loans—defined as loans that are 90 days or more past due—are higher in the South compared to the national average.²²
What you should know as tariff tensions rise.
While there is much uncertainty about what will ultimately shake out from bilateral trade negotiations, the South is highly exposed to the impact of tariffs. The region accounted for 38 percent of all U.S. imports in 2024, far higher than any other region.²³ While the South is less reliant on Chinese imports than the West, several Southern states have high trade exposure to China. Arkansas, Mississippi, Oklahoma, South Carolina, Tennessee, Virginia and the District of Columbia all derive at least 14 percent of their imports from China.
Understanding the Southern consumer
The South presents a compelling opportunity for businesses, with a rapidly growing and dynamic consumer base. Compared to the national average, the region skews younger—27 percent of its population is aged 20 to 39, compared to just 21 percent nationwide.²⁴ This younger age profile is fueled by strong international and domestic migration as well as higher birth rates. Nearly 60 percent of Southern households are married couples, significantly above the U.S. average of 47 percent. ²⁵
While incomes are generally lower—35 percent of households earn less than $50,000—lower housing costs and lower taxes allow Southern households to allocate more of their budgets toward discretionary spending.²⁶ Urbanization is also high across the region, with 85 percent of residents living in metro areas, compared to 80 percent nationally.²⁷ Combined with strong growth and growing economic diversification, the South’s demographics create tailwinds for continued upward mobility.
So how can brands effectively reach Southern consumers?
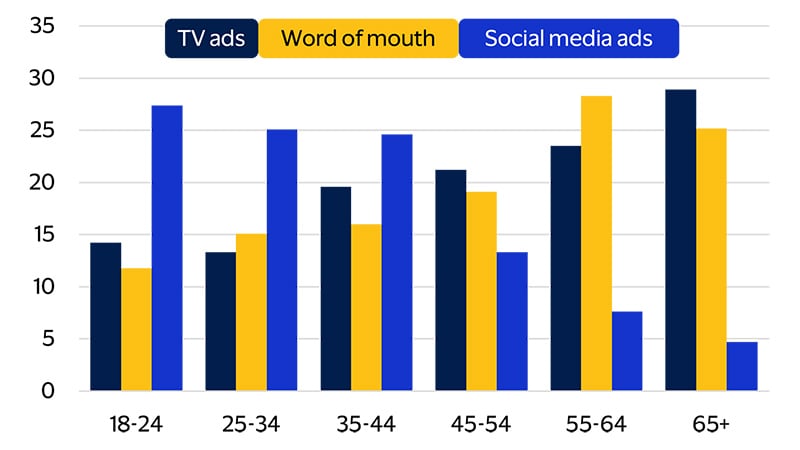
We find that advertising efforts focusing heavily on TV and social media significantly outperform others in the South.* Younger consumers primarily discover new products through social media and TV, while older consumers tend to be influenced by word-of-mouth and TV advertising. Tailoring marketing strategies by age segment is key to unlocking brand growth. According to our quarterly consumer survey, the 18–24, 25–34, and 35–44 age groups report discovering products through social media ads at rates of 27 percent, 25 percent, and 25 percent, respectively. Meanwhile, older age groups—45–54, 55–64, and 65+—are more responsive to TV ads, with discovery rates of 21 percent, 24 percent, and 29 percent (see figure below). This underscores the need for a dual-pronged strategy: Lean into social media to engage younger consumers and prioritize TV advertising to reach older demographics. Ultimately, brands that adapt their media mix and messaging to align with the South’s demographic makeup and media preferences will be best positioned to thrive in this fast-evolving market.
Looking ahead, the South is poised to continue outpacing other regions thanks to its demographic tailwinds, affordability and evolving labor market. For brands and businesses, understanding and adapting to the South’s unique characteristics will be key to successfully investing and expanding in this region.
The way to reach Southern consumers varies considerably by age group
Top places Southern consumers learn about new products, by age (percent, January 2025)
Footnotes
- Visa uses the U.S. Census Bureau’s regional designations, which for the South include Alabama, Arkansas, Delaware, District of Columbia, Florida, Georgia, Kentucky, Louisiana, Maryland, Mississippi, North Carolina, Oklahoma, South Carolina, Tennessee, Texas and Virginia
- Visa Business and Economic Insights and U.S. Department of Commerce
- Visa Business and Economic Insights and U.S. Department of Commerce
- Visa Business and Economic Insights and U.S. Department of Commerce
- Visa Business and Economic Insights and U.S. Department of Commerce
- Visa Business and Economic Insights and Cato Institute
- Visa Business and Economic Insights and U.S. Department of Commerce
- Visa Business and Economic Insights and U.S. Department of Commerce
- Visa Business and Economic Insights and National Association of Realtors
- Visa Business and Economic Insights and U.S. Department of Labor
- Visa Business and Economic Insights and U.S. Department of Labor
- Visa Business and Economic Insights and U.S. Department of Labor
- Visa Business and Economic Insights and Tax Foundation
- Visa Business and Economic Insights and U.S. Department of Labor
- Visa Business and Economic Insights and U.S. Department of Labor
- Visa Business and Economic Insights and U.S. Department of Commerce
- Visa Business and Economic Insights and U.S. Department of Commerce
- Visa Business and Economic Insights and U.S. Department of Energy
- Visa Business and Economic Insights and U.S. Department of Labor
- Visa Business and Economic Insights and National Association of Realtors
- Visa Business and Economic Insights and Federal Reserve Bank of Dallas
- Visa Business and Economic Insights and TransUnion
- Visa Business and Economic Insights and U.S. Department of Commerce
- Visa Business and Economic Insights and U.S. Department of Commerce
- Visa Business and Economic Insights and U.S. Department of Commerce
- Visa Business and Economic Insights and U.S. Department of Commerce
- Visa Business and Economic Insights and U.S. Department of Commerce
Forward-Looking Statements
This report may contain forward-looking statements within the meaning of the U.S. Private Securities Litigation Reform Act of 1995. These statements are generally identified by words such as “outlook”, “forecast”, “projected”, “could”, “expects”, “will” and other similar expressions. Examples of such forward-looking statements include, but are not limited to, statements we make about Visa’s business, economic outlooks, population expansion and analyses. All statements other than statements of historical fact could be forward-looking statements, which speak only as of the date they are made, are not guarantees of future performance and are subject to certain risks, uncertainties and other factors, many of which are beyond our control and are difficult to predict. We describe risks and uncertainties that could cause actual results to differ materially from those expressed in, or implied by, any of these forward-looking statements in our filings with the SEC. Except as required by law, we do not intend to update or revise any forward-looking statements as a result of new information, future events or otherwise.
Disclaimers
The views, opinions, and/or estimates, as the case may be (“views”), expressed herein are those of the Visa Business and Economic Insights team and do not necessarily reflect those of Visa executive management or other Visa employees and affiliates. This presentation and content, including estimated economic forecasts, statistics, and indexes are intended for informational purposes only and should not be relied upon for operational, marketing, legal, technical, tax, financial or other advice and do not in any way reflect actual or forecasted Visa operational or financial performance. Visa neither makes any warranty or representation as to the completeness or accuracy of the views contained herein, nor assumes any liability or responsibility that may result from reliance on such views. These views are often based on current market conditions and are subject to change without notice.
Visa’s team of economists provide business and economic insights with up-to-date analysis on the latest trends in consumer spending and payments. Sign up today to receive their regular updates automatically via email.