Economic outlook and forecasts Asia Pacific consumer spending: What to expect in 2026

The cautious consumer prevails
Economic anxiety will define consumer behavior across the region in 2026. Despite weathering recent geopolitical turbulence quite well, consumer confidence remains weak across many of the region’s countries and territories. In Mainland China, the region's largest market, consumer sentiment fell slightly below 90 in the fourth quarter of 2025—down from a peak of 124.4 in mid-2021. In Taiwan and Australia, as well, the sentiment remained mostly unfavorable in 2025. New Zealand saw some improvement but remained below 2020-21 levels.
Global uncertainties are making consumers uneasy, but so is the employment scenario. Trade tensions continue to pose risks for export-dependent markets like Mainland China and Vietnam, while artificial intelligence threatens entry-level office jobs in the Philippines and India.
A crisis of confidence among Asia Pacific consumers
Consumer Sentiment Index, ≥100= favorable (Last actual: Q4-2025)
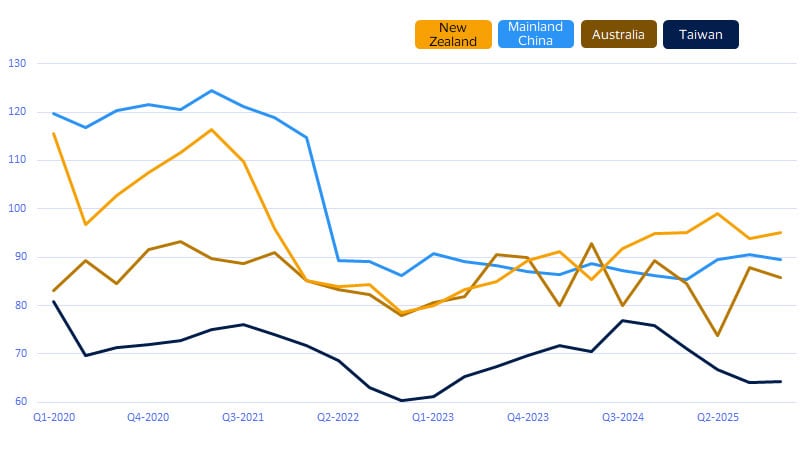
Youth unemployment deserves attention in Mainland China and India, the region's two largest consumer markets. In Mainland China, youth joblessness stood at 16.9 percent in November 2025.¹ India, which has outperformed global peers in hiring, could see hiring volumes dip in early 2026.²
On the other hand, inflation has moderated, offering some relief, but affordability remains a concern, especially as the base-effect benefits for food prices fade in 2026. After years of above-target inflation in major economies like Japan and Australia, consumers care less about runaway prices and more about whether they can afford everyday purchases. For businesses, simply slowing price hikes will not be enough. Demonstrating clear, tangible value will be essential to winning over cautious consumers.
The passion economy takes center stage
As the youngest millennials prepare to turn 30 in 2026, the mantle of ‘kidults,’ those clinging on to youthful pursuits, will pass to Generation Z. But this new cohort of consumers will not be easy to decipher, as their spending patterns reflect a tension between financial pressure and emotional drivers. Competition for entry-level office roles is pushing many young adults toward the gig economy,³ forcing more cautious, value-oriented budgeting. At the same time, Gen Z is spending freely on categories tied to identity and community, fueling a passion economy built around anime, K-pop, e-sports, niche gaming and other fandoms.
Gen Z tends to splurge on emotional support toys
Share of responses (percent) in select markets* to the statement: I often buy beautiful but non-essential things
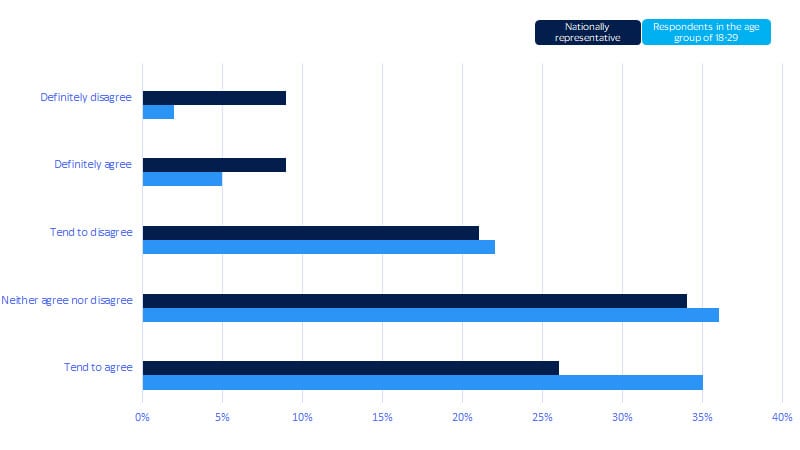
In Japan, nearly half of workers in their twenties engage in "oshikatsu"—a local term for indulging in fandom activities, supporting favorite idols or anime characters, buying merchandise and attending events.⁴ This spending appears largely unaffected by inflation. In Mainland China, plush soft toys, concert tickets, rare anime and comics serve as both emotional outlet and status symbol, with Gen Z consumers on average spending $133** per month on these items.⁵ Social media fatigue among digital natives is also driving demand for certain offline connections, further strengthening the trend.
If passion offers clues to Gen Z’s spending intent, their housing situation can help explain their purchasing power. With rent and property prices at record highs, many young people are returning to or remaining in their parents' homes—in some cases leaning into the multigenerational living culture of certain markets—reducing their fixed costs and boosting their purchasing power. Data from Singapore shows that while the overall number of households with children has been declining, households with a youngest child over 16 years of age rose by over 12 percent in 2018 to 2024—evidence of Gen Z staying home longer and freeing up income for discretionary spending.
**Note: Unless otherwise mentioned, all $ values in this report refer to the U.S. dollar.
Affluent Asians will redraw the luxury map
The region's consumer landscape is undergoing a structural shift as rising affluence in developing economies fuels demand for premium goods and experiences. Visa Business and Economic Insights analysis of anonymized VisaNet data suggests that Mainland China will remain the anchor, with expected luxury spending of $89.8 billion and 13 percent growth in 2026.
But the most dramatic story is India, where the luxury market is forecast to surge 20 percent to $22.6 billion, driven by urbanization, a strong tech startup ecosystem and a young demographic eager for status-affirming purchases. This pattern repeats across Southeast Asia: Indonesia's luxury market will reach $3.1 billion while Thailand's hits $3.3 billion, both expanding at double-digit rates. In contrast, Japan's flat trajectory at $30.9 billion reflects a sizable but mature market affected by demographic headwinds.
The strategic implication is clear: Brands must look beyond established markets like Japan, Hong Kong, Singapore and Mainland China for faster growth. Emerging affluent consumers in developing markets are seeking accessible entry points into premium lifestyles. Success requires localized strategies that understand these aspirational consumers rather than simply transplanting approaches from mature markets.
Mainland China, Japan will remain biggest Asian luxury markets, while India will grow the fastest
Luxury spending by cards issued in these markets to purchase globally in 2026 ($ billion); percentage change in spending in 2023-2026

Silver economy comes of age
Asia is aging faster than many realize, and this holds implications for the consumer economy. In 2026, the share of population aged 65 and above will surpass 15 percent in Mainland China and Singapore, while approaching 25 percent in Hong Kong. In fact, only 6 out of 16 countries we studied in the region will have a share of the aging population below the global average of 10 percent.⁶
This isn't just a story about developed economies: Developing economies like Thailand and Vietnam are catching up quickly. While those above 65 will represent nearly 10 percent of Vietnam's population, the share stands at 16.7 percent for Thailand. Even India, the world’s most populous and still a very young country, has seen the national fertility rate dip below the population replacement rate of 2.1.⁷
While aging populations fuel concerns of slowing productivity and rising healthcare and other social costs, it is helpful to remember that this growing senior cohort commands significant disposable income and assets, amassed during decades of sustained economic growth.
While healthcare and essentials claim a portion, discretionary spending of senior citizens is not insignificant. In Mainland China, State Tax department data shows revenue from fitness equipment, rehabilitation aids and nutritional products for the elderly grew 15 percent, 12 percent and 7 percent respectively in the first half of 2025, while revenue from elderly-friendly travel and entertainment surged by 20 percent.⁸
Japan demonstrates the same pattern. Senior households allocated over 11 percent of their significant monthly expenditure to culture and recreation in 2024. This silver economy is moving beyond necessity, creating robust markets for businesses that can cater to the wellness, leisure and entertainment demands of an active and affluent older generation.
AI-powered commerce gains traction
We expect 2026 to mark a significant step toward the mainstream adoption of agentic commerce—AI-powered assistants and platforms that automate and personalize the shopping process. The region’s tech-savvy consumers, already accustomed to e-commerce, digital payments and social commerce, are primed for this evolution. In fact, they are often more enthusiastic than their global counterparts when it comes to innovations around shopping and financial planning.
Asian consumers exhibit more enthusiasm about innovation in shopping
Most interesting shopping innovation, percent who ranked each choice as #1
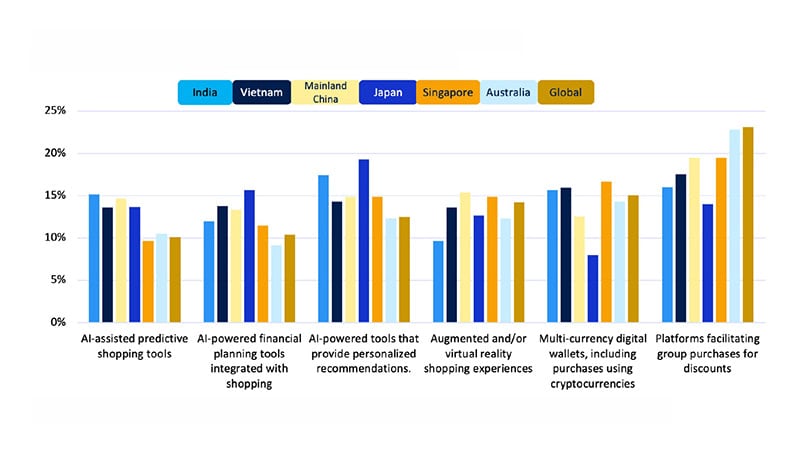
Familiarity and usage of generative AI tools is also growing. In Australia and New Zealand, AI usage among the working‑age population stands at 34 percent and 37 percent, respectively. Consumers across Singapore, Taiwan, South Korea and Vietnam also report strong adoption, scoring over 20 percent.⁹
However, widespread adoption of AI‑driven e‑commerce will depend on a clear value proposition. AI agents that save consumers time, help them find better deals or reduce friction in product discovery are likely to gain traction fastest. Yet concerns will remain—particularly around privacy and control. Consumers are often hesitant to share personal data with AI agents and even less willing to grant access to financial information. Businesses hoping to lead in this space will need to ensure their systems are not only valuable and convenient, but also transparent and trustworthy.
In the meantime, consumers are increasingly turning to AI for product discovery and comparison. As AI‑based search integrations expand across e‑commerce platforms, merchants will need to ensure that their products and services are easily discoverable on these applications. This will help ensure their offerings are accurately represented on AI‑driven apps, while building consumer familiarity and confidence with a new way of shopping.
Please download the report to view additional charts and forecast data.
Footnotes
- South China Morning Post, China’s jobless rate for young people eases to 16.9% as graduates settle for less, Feb. 4, 2026
- The Economic Times, More companies plan hiring in March quarter as India Inc stays upbeat, with 63% employers looking to hire, Feb. 4, 2026
- Tokyo Weekender, Young Japanese workers spend big on idol fandom, Feb. 4, 2026
- Soul App, Feb. 4, 2026
- South China Morning Post, Why China’s Gen Z is turning to plush toys and AI for emotional support, Feb. 4, 2026
- World Bank, Population ages 65 and above (% of total population), Feb. 4, 2026
- The Times of India, India’s falling fertility rate: A public health crisis, Feb. 4, 2026
- State Taxation Administration of the People’s Republic of China, Announcement on the Implementation of the China–Macao Arrangement for Avoidance of Double Taxation, Feb. 6, 2026
- Microsoft, Global AI Adoption 2025, Feb. 4, 2026
Forward-Looking Statements
This report may contain forward-looking statements within the meaning of the U.S. Private Securities Litigation Reform Act of 1995. These statements are generally identified by words such as “outlook”, “forecast”, “projected”, “could”, “expects”, “will” and other similar expressions. Examples of such forward-looking statements include, but are not limited to, statements we make about Visa’s business, economic outlooks, population expansion and analyses. All statements other than statements of historical fact could be forward-looking statements, which speak only as of the date they are made, are not guarantees of future performance and are subject to certain risks, uncertainties and other factors, many of which are beyond our control and are difficult to predict. We describe risks and uncertainties that could cause actual results to differ materially from those expressed in, or implied by, any of these forward-looking statements in our filings with the SEC. Except as required by law, we do not intend to update or revise any forward-looking statements as a result of new information, future events or otherwise.
Disclaimers
The views, opinions, and/or estimates, as the case may be (“views”), expressed herein are those of the Visa Business and Economic Insights team and do not necessarily reflect those of Visa executive management or other Visa employees and affiliates. This presentation and content, including estimated economic forecasts, statistics, and indexes are intended for informational purposes only and should not be relied upon for operational, marketing, legal, technical, tax, financial or other advice and do not in any way reflect actual or forecasted Visa operational or financial performance. Visa neither makes any warranty or representation as to the completeness or accuracy of the views contained herein, nor assumes any liability or responsibility that may result from reliance on such views. These views are often based on current market conditions and are subject to change without notice.
Visa’s team of economists provide business and economic insights with up-to-date analysis on the latest trends in consumer spending and payments. Sign up today to receive their regular updates automatically via email.