A year of known unknowns: The shifting policy landscape will define growth in 2025

December 2024 – As we turn the page to 2025, it is worth noting the positive trends in 2024 that are likely to carry over into next year. For starters, economic growth was much stronger than many anticipated, particularly given the higher interest rate environment that dominated throughout much of the year. Real (inflation-adjusted) disposable income growth remained robust, helping to shield some consumers from high interest rates and powering consumer spending growth. Similarly, corporations continued to sit on a large amount of cash, a factor that propelled business investment during the high-rate environment.
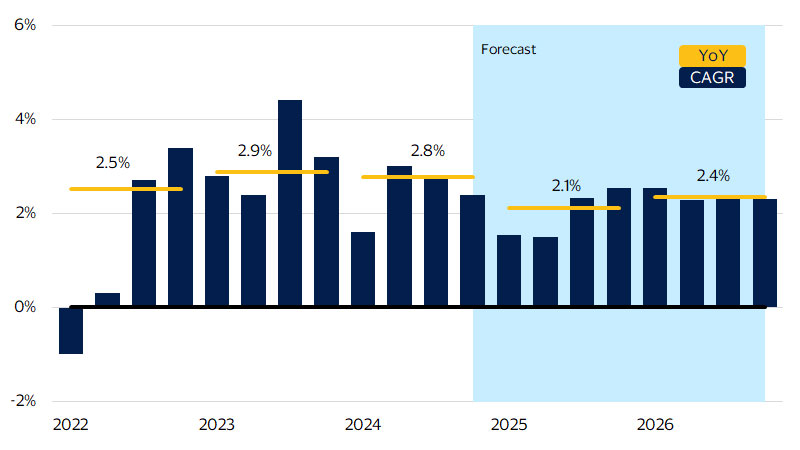
Looking ahead, 2025 will be characterized by continued solid economic growth. Gross domestic product (GDP) growth will likely return near trend next year, at a rate of 2.1 percent year-over-year (YoY), down from an estimated 2.8 percent this year (see figure below). As the Federal Reserve trims rates, continued consumer spending and business investment, particularly equipment, will be core supports to growth. While these will serve as pillars of strength next year, commercial and residential construction activity and more modest government spending are expected to tamp down GDP below 2024’s growth rate. Additionally, 2025 will be a year of policy-induced uncertainty in our view, with monetary policy, fiscal policy and geopolitical tensions all likely to create some risks to the outlook. Our baseline economic forecast for next year is influenced by five key factors that will shape the economy in the year ahead.
Real GDP growth forecast
(SA,* CAGR and YoY percent change)
Five key factors that will shape the economy in 2025:
- Slower job growth in 2025, but not for the reasons you may think
- The normalization of consumer spending: A tale of two halves and two consumers
- Inflation should slowly fall to 2 percent, but not below
- A shifting interest rate environment should help boost credit availability
- Fiscal policy a focus in 2025
Slower job growth in 2025, but not for the reasons you may think
Several trends we observed in the U.S. labor market this year are likely to continue into 2025. Employment growth started out strong in Q1-2024 but lost steam as the year progressed, averaging just below 150,000 jobs per month in the second and third quarters after accounting for several downward revisions.
More modest job growth, however, did not correspond to a sharp uptick in layoff activity. First time filings for unemployment insurance benefits held relatively steady throughout the year. Most of the downshift in job gains came from a combination of fewer job openings and firms not replacing some retiring workers, rather than through layoffs. We expect this trend to further intensify in 2025 as more baby boomers leave the workforce. The ratio of job openings to unemployed workers—a key metric of supply and demand in the labor market—is hovering just above 1:1. This implies that there are slightly more job openings than available workers to fill them (see fig. 2 in full report).
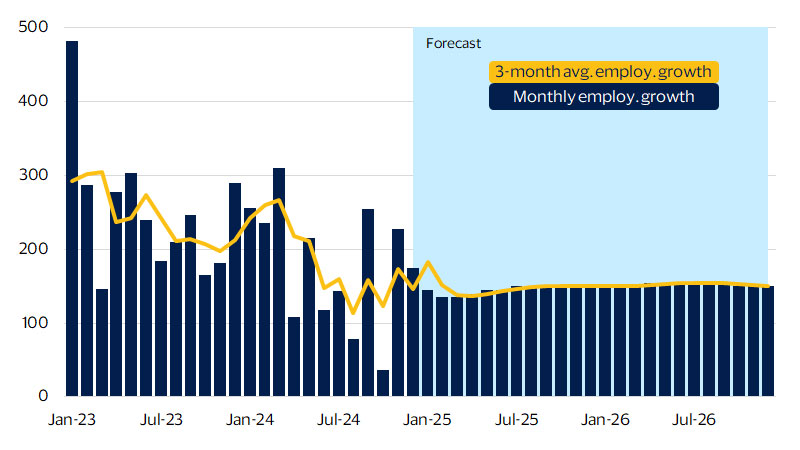
Among the factors expected to limit labor supply in the year ahead is the aging of the U.S. population. According to the U.S. Census Bureau, roughly 12,000 baby boomers per day are reaching the key retirement age of 65. As a result of fewer job openings and a likely flat-to-declining workforce, we expect job growth to average 144,000 per month in 2025, down from an estimated 180,000 in 2024 (see chart below). In our view, the slower pace of job gains will have more to do with the availability of labor to fill positions rather than firms reducing headcount.
Monthly employment growth forecast
(SA, monthly change in thousands)
The normalization of consumer spending: A tale of two halves and two consumers
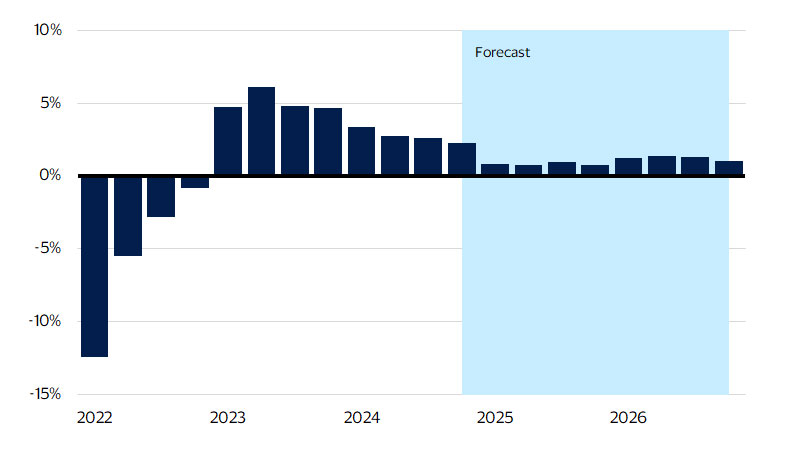
A relatively tight labor market next year should lead to steady gains in wage growth and, by extension, real (inflation-adjusted) disposable income growth (see figure below). Combined with wealth effects from gains in the housing and stock markets, we expect consumers to be well positioned to support aggregate spending growth next year.
The composition of consumer spending in 2025 is likely to be shaped by the timing of interest rate cuts. Relatively high borrowing costs during the first half of the year are expected to ease by the second half as the Federal Reserve trims interest rates. The subsequent decrease in borrowing costs may lead to an uptick in less frequent, large-ticket purchases. Lower borrowing costs are also likely to boost home sales, leading to a rise in home improvement projects and furniture purchases. Another big-ticket item likely to benefit from lower rates are autos. Lower financing costs will make monthly payments more affordable, as well as make it easier for consumers to qualify for auto loans. Lower interest rates will also reduce the cost of leasing a vehicle, further driving renewed demand in the auto sector.
However, the pivot to more big-ticket purchases in H2-2025 may not be true for all consumers. Next year will not only be a tale of two halves for consumer spending, but also a tale of two consumers where affluent and middle-income consumers will likely fare far better than lower-income consumers. Affluent consumers (top third of the income distribution) are thriving, as they account for 56 percent of spending.¹ These households have benefited from a strong labor market, increasing real wages, a booming stock market, and rising home prices. Most also have substantial savings and long-term, fixed-rate mortgages at low rates. Similarly, middle-income consumers (middle third of the income distribution), who account for just under 30 percent of spending, are also doing reasonably well. Most of these households have modest 401(k) plans and are homeowners. They have tended to spend more cautiously in 2024 but continue to support overall consumption. Thanks to the income, savings, and wealth profiles of affluent and middle-income consumers, we expect both to be in a very strong position to support consumer spending growth in 2025.
Real disposable income
(SA, YoY percent change)
In contrast, the bottom third of the income distribution is struggling. These households, which typically account for one-seventh of total spending, are employed and have seen real wage gains but have exhausted their excess savings.² They are far less likely to own stocks or homes and have turned to credit to maintain their spending. With high interest rates stretching their budgets, these consumers are likely to continue pulling back on spending to make ends meet. We expect next year will be characterized by the two consumers, with the affluent and middle-income consumers helping to support aggregate consumption growth while those lower-income households tread water until a lower rate environment begins to ease some pressure on their budgets.
Despite challenges for lower-income consumers, stock and home prices remain at record highs, and household debt loads are relatively light. This overall economic environment suggests that while there are pockets of financial strain, consumer spending is positioned for continued growth in 2025 but will likely revert to the growth rate observed in the last expansion. Nominal consumer spending is expected to normalize near its prior expansion trend growing 4.8 percent YoY in 2025, down from an estimated 5.2 percent pace in 2024 (see fig. 5 in full report). Most of the downshift in nominal spending is related to an ongoing moderation in inflation. On an inflation-adjusted basis, we see real consumer spending expanding 2.0 percent YoY next year, down from an estimated 2.7 percent growth this year.
Inflation should slowly fall to 2 percent, but not below
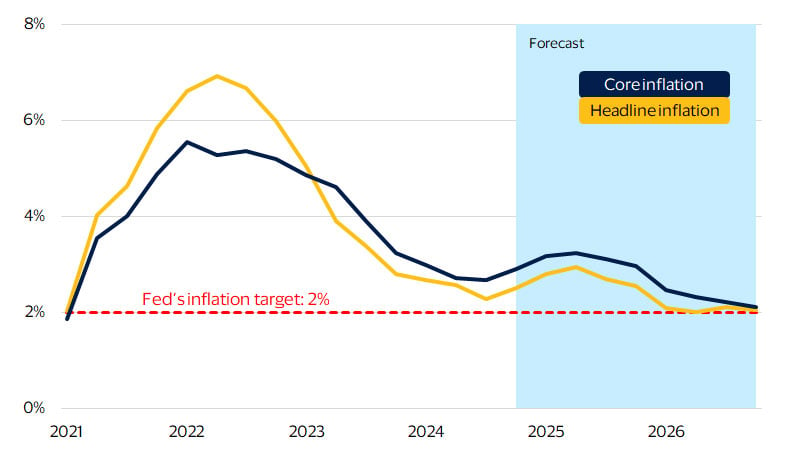
The Federal Reserve is set to enter 2025 in the “last mile” of its inflation fight. The personal consumption expenditures (PCE) deflator—the Fed’s preferred inflation measure—is tracking at 2.3 percent as of October. But while inflation is inching closer to the Fed’s 2 percent target, we expect this last bit of inflation to remain sticky at or above 2 percent in 2025. The days of below 2 percent inflation observed in the prior expansion from 2010-2019 are not likely to occur in the current expansion.
Falling energy prices, especially gasoline, and stabilizing food prices have helped cool inflation. After stripping out these more volatile price components, though, so-called core inflation remains stubbornly high at 2.8 percent as of October. This is because the costs of labor-intensive services remain elevated, particularly healthcare, transportation and financial services. The aggregation of these labor services accounts for 70 percent of the growth in core inflation (see fig. 6 in full report).
Labor service pricing pressures are unlikely to ease significantly in 2025. While the labor market has softened, there are still more job openings than unemployed persons. Retiring baby boomers and slowing immigration will be headwinds for labor force growth. Healthcare prices will be pressured by a double whammy of aging Americans and worker shortages, while insurance costs face continued pressure on the back of natural disasters.
Housing costs have also been a significant contributor to inflation and will continue to add inflationary pressures in 2025 for two reasons. First, home prices are estimated using owner’s equivalent rent, which is the hypothetical rent homeowners would pay if they rented their home instead of owning it. As a result, today’s rental and home prices take time to show up in the inflation data because rental agreements—and therefore rental prices—do not turn over frequently. Secondly, the mortgage lock-in effect has caused home prices to continue rising even throughout the high-interest rate environment of the past several years. Homeowners with low rates are hesitant to list their home and risk losing their low mortgage rate. As mortgage rates gradually come down, a pickup in home sales will likely be met with further price increases.
Stronger-than-expected consumer demand, supported by robust income growth, largely drove inflation in 2024. We expect this dynamic to continue in 2025 given the relative tightness in the labor market, albeit at a moderating pace as job and income growth cool in the first half of next year. Additionally, we expect the incoming administration to enact a set of tariffs that will create a level shift higher in inflation. Our forecast calls for both headline and core inflation, as measured by the PCE deflator, to average 2.5 percent YoY growth by Q4-2025, unchanged from our estimate of Q4-2024 growth (see figure below). Nonetheless, sticky factors are driving pricing pressures and volatile food and energy costs are easing pricing pressures, which means inflation risks in 2025 will be tilted to the upside.
PCE and core PCE deflator forecast
(SA, YoY percent change)
A shifting interest rate environment should help boost credit availability
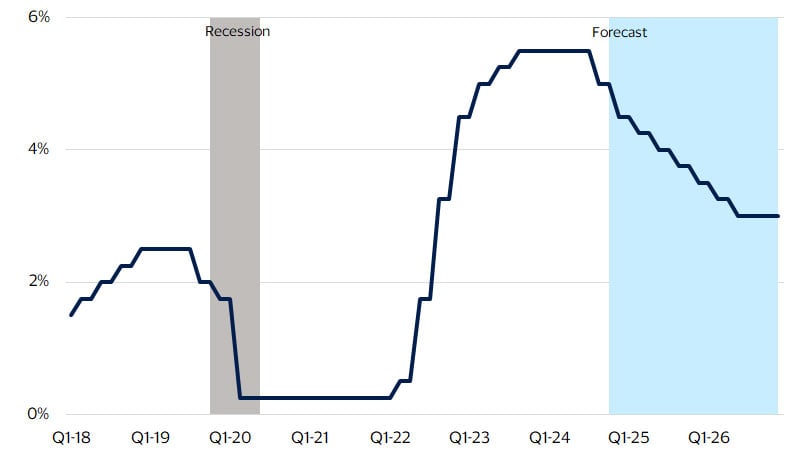
With rates still clearly in restrictive territory, further easing is in the pipeline as the Fed tries to bring interest rates down to a level that neither stimulates nor cools the economy. As interest rates gradually decline, credit fundamentals will improve in 2025; however, resilient consumer spending and likely policy changes by the incoming administration pose some significant upside risks to inflation. As such, we expect the Fed to move more cautiously in 2025, cutting rates by 25 bps at every other meeting until reaching an upper limit of 3.5 by the end of the year and a target range of 2.5 to 3 percent in the second quarter of 2026 (see figure below). The higher expected target range reflects the upside risks to inflation that will persist in 2025 and beyond.
With the Fed’s gradual rate cut path, we expect to see an upward sloping yield curve in 2025 (see fig. 9 in full report). As the federal funds rate comes down and the inverted yield curve unwinds, credit availability should broaden. Banks will be able to resume their core business of using deposits that pay short-term rates and lending at higher long-term rates. Additionally, the high federal funds rate has enabled financial institutions to earn a high yield with zero risk over the past few years by parking excess deposits at the Federal Reserve. But as the federal funds rate comes down, banks will be incentivized to lend more as that risk-free rate comes down. We expect rates to be fairly restrictive through the first half of 2025, with gradual rate cuts resulting in interest rate dynamics in the second half of the year that are more positive for economic growth.
Federal funds rate forecast
(percent)
Fiscal policy a focus in 2025
Next year will mark the start of a new, Republican-controlled administration and Congress. With the change in party control, we suspect that a number of policy changes will be enacted. However, outside of the president-elect’s announced tariffs, we expect most of these major policy changes to affect the economy in 2026. Our outlook for fiscal policy currently assumes that the new administration will extend the existing Trump tax cuts passed in 2017 and set to expire at the end of 2025, and will impose the aforementioned tariffs on Canada, Mexico and China shortly after taking office.
In the absence of more specific policy details, we are not building any other policy assumptions into our forecast at this time. As the new leadership introduces more well-defined policies and legislation, we will adjust our forecast based on the likelihood of those policy proposals being enacted. In many cases, policies proposed on the campaign trail look very different by the time they are enacted. While we are not building in assumptions around all the incoming administration’s key policy priorities, for some aspects of the economy, we do have a general idea of how our forecast would change if certain proposals from the campaign are enacted as stated. The following are high-level proposals from President-elect Trump’s campaign:
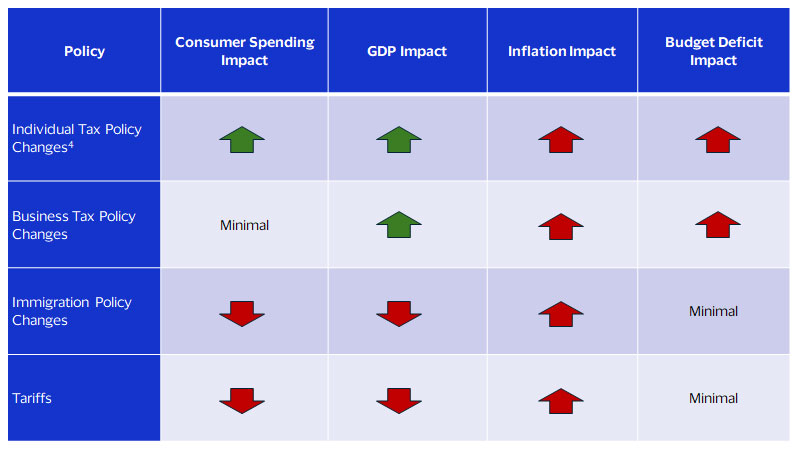
Individual tax policy proposals: Extend and expand Trump tax cuts, remove state and local deduction cap, eliminate taxes on Social Security benefits.
This set of policies would be additive to consumer spending and thus overall GDP growth, as consumers’ after-tax incomes would be higher. Given our current baseline of solid GDP growth, stronger spending growth would be inflationary in our view. Additionally, budget deficits could be significantly higher than our current outlook if there are few offsets for the reduction in revenues.
Business tax policy proposals: Lower the corporate income tax rate to 15 percent and extend the business tax provisions from the first set of Trump tax cuts.
These polices would have minimal impact on consumer spending but would boost business spending and investment, adding to GDP growth. The additional business spending would likely be inflationary, but less so than individual tax cuts. Budget deficits would also be higher under this policy change.
Immigration: Secure the nation's borders and deport undocumented immigrants.
Reducing the number of individuals in the economy and workforce would reduce the consumer base and thus slow overall consumer spending and GDP growth. Fewer workers would also adversely impact the labor market by pushing wages higher, which would likely result in higher inflation—particularly in the service sector. The net impact to the federal budget would likely be minimal, as tax revenues would decline but so too would benefits to immigrants.
Implement tariffs: Impose a 25 percent across-the-board tariff on goods imported from Mexico and Canada and an additional 10 percent tariff on imports from China.
One area that is coming into sharper focus is President-elect Trump’s tariff policy. Given his announcement that he will sign an executive order to impose these tariffs on his first day in office, our forecast now assumes that they will be in place throughout most of 2025.
Tariffs are a tax on imported goods paid by businesses and consumers. Based on our model work, grounded in the economic literature, we estimate that these tariffs will push inflation 0.6 percentage points higher in 2025 relative to our November forecast.³ This onetime increase in price levels (inflation) would likely slow consumer spending, with higher prices eroding the real purchasing power of consumers. Given that the tariffs would represent a one-time level shift higher in prices, we do not expect the Federal Reserve to alter their rate cutting plans based on tariffs alone. In fact, the slower growth resulting from tariffs would likely bring the economy back towards its potential growth rate, reducing the chances of higher inflation in the future. Additionally, if implemented as announced, these tariffs would likely result in retaliatory tariffs by trading partners, slowing U.S. exports and manufacturing activity. On net, GDP growth is now expected to be slower than our November forecast. Federal budget impacts would likely be minimal, as increased tariff revenues would likely be offset by slower economic growth and lower corporate tax collections due to weakening profit margins.
The potential economic impacts in the table below represent only short-term effects that would occur over our 2025-2026 forecast horizon. Long-run impacts may be directionally different. While the impacts shown are isolated to one set of policy changes, in reality, we suspect that several of these policies could be enacted simultaneously, thus having some offsetting effects on the economy. The magnitude of these impacts will vary depending on the details of the policies ultimately enacted.
Directional effects on the economy of selected policy proposals
Risks to the outlook
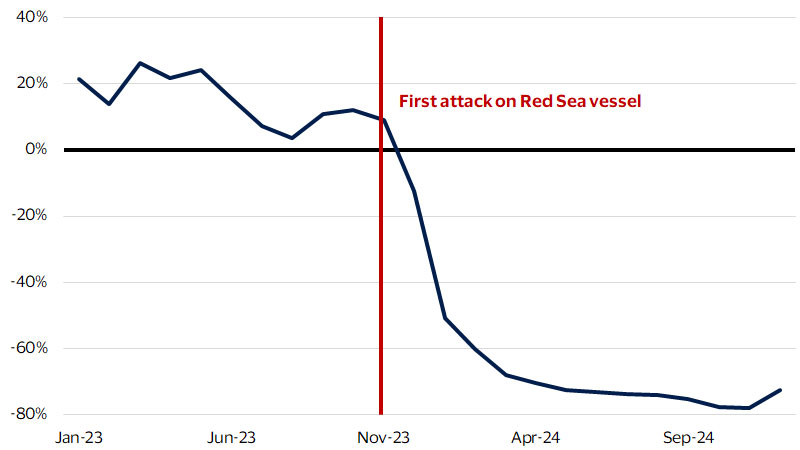
Red Sea monthly average volume growth
(YoY percent change)
Similarly, an escalation of the war in Ukraine could put pressure on the world’s food supply, potentially reaccelerating food inflation and putting significant strain on consumers. Tensions between the U.S. and China over Taiwan, along with wide-ranging tariffs on key trading partners, also have the potential to reignite inflation by increasing the cost of imports. The upside risk to inflation from these geopolitical risks would likely lead to interest rates remaining higher for longer, weighing on consumer and business spending. Should the Federal Reserve delay cutting rates, consumers would not only be less likely to increase their spending, but a prolonged yield curve inversion could result in continued tight credit conditions.
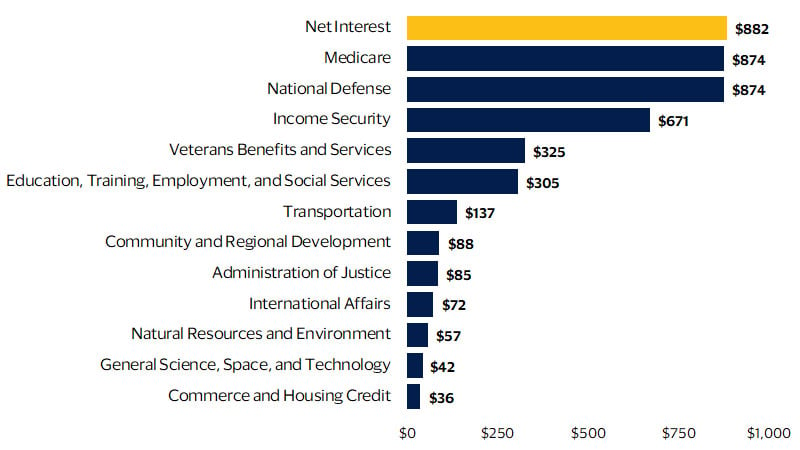
Finally, we view the federal budget deficit as an important potential risk to growth in 2025. Growth in the federal budget deficit, which is now close to 6 percent of GDP, could lead to protracted high interest rates as the government competes with the private sector for loanable funds. Higher rates in the market can crowd out private investment, reducing the funds available for businesses to expand and innovate. This would also keep mortgage rates elevated, slowing the recovery in housing. Additionally, a large portion of the budget is currently allocated to interest payments on debt (see figure below), leaving less available for productive government investments in infrastructure, education, and other areas that can add to economic growth.
Geopolitical tensions, uncertainty over the outlook for rate cuts, and a large federal budget deficit could adversely impact the U.S. economy in the year ahead by creating an unpredictable business environment, reducing consumer and business confidence and crowding out private investment. These factors could lead to slower economic growth and increased economic instability in the coming year than what we have currently built into our outlook. As we sit on the cusp of a new year, we want to thank our valued clients, partners, and regular readers for allowing us into your inbox. We wish all of you the best in the year ahead.
Federal spending by selected functions
(Billions, US $)
Footnotes
- Visa Business and Economic Insights and U.S. Department of Labor
- Visa Business and Economic Insights and U.S. Department of Labor
- PCE deflator inflation impact analysis by Visa Business and Economic Insights based on the work of Hale, G., Hobijn, B., Nechio, F. and Wilson, D. (Feb. 25, 2019). Inflationary Effects of Trade Disputes with China. FRBSF Economic Letter. Federal Reserve Bank of San Francisco and Tombs, S. and Allen, O. (Nov. 2024). The United States Economic Monitor. Pantheon Macroeconomics. Economic impact analysis based on Fried, D. (Aug. 22, 2019). The Effects of Tariffs and Trade Barriers in CBO’s Projections. Congressional Budget Office. Federal Reserve Bank of San Francisco.
- Individual tax policy impacts are smaller, as the economy responds based on marginal changes to income. Extending current tax cuts on the margin does not have a material impact to our forecast but expanding the tax cuts would. Thus, the net impact is smaller.
Forward-Looking Statements
This report may contain forward-looking statements within the meaning of the U.S. Private Securities Litigation Reform Act of 1995. These statements are generally identified by words such as “outlook”, “forecast”, “projected”, “could”, “expects”, “will” and other similar expressions. Examples of such forward-looking statements include, but are not limited to, statements we make about Visa’s business, economic outlooks, population expansion and analyses. All statements other than statements of historical fact could be forward-looking statements, which speak only as of the date they are made, are not guarantees of future performance and are subject to certain risks, uncertainties and other factors, many of which are beyond our control and are difficult to predict. We describe risks and uncertainties that could cause actual results to differ materially from those expressed in, or implied by, any of these forward-looking statements in our filings with the SEC. Except as required by law, we do not intend to update or revise any forward-looking statements as a result of new information, future events or otherwise.
Disclaimer
The views, opinions, and/or estimates, as the case may be (“views”), expressed herein are those of the Visa Business and Economic Insights team and do not necessarily reflect those of Visa executive management or other Visa employees and affiliates. This presentation and content, including estimated economic forecasts, statistics, and indexes are intended for informational purposes only and should not be relied upon for operational, marketing, legal, technical, tax, financial or other advice and do not in any way reflect actual or forecasted Visa operational or financial performance. Visa neither makes any warranty or representation as to the completeness or accuracy of the views contained herein, nor assumes any liability or responsibility that may result from reliance on such views. These views are often based on current market conditions and are subject to change without notice.
Visa’s team of economists provide business and economic insights with up-to-date analysis on the latest trends in consumer spending and payments. Sign up today to receive their regular updates automatically via email.