Economic outlook and forecasts Travel, trade and AI shaping Asia Pacific’s economies

February 2026 – Asia Pacific entered 2026 with resilient consumer spending, expanding online commerce and deeper cross-border integration, despite external challenges. Visa’s data, drawing on billions of anonymized transactions, shows three key trends: a spending shift from services to goods; travel as the hottest regional purchase; and AI hotspots and trade re-routing altering pricing and payments.
Asia Pacific has long been the world’s fastest growing region by GDP. The drivers of growth differ markedly by country, but common fundamentals across the emerging markets are urbanization, business-friendly policy reforms, solid infrastructure and quality education. For advanced economies, commanding positions in technology, trade and natural resources maintain living standards. While growth is resilient, it is slowing as rising trade barriers, a higher cost of capital, rapidly aging populations and structural change in China reduce the effectiveness of traditional export-oriented manufacturing-led growth.
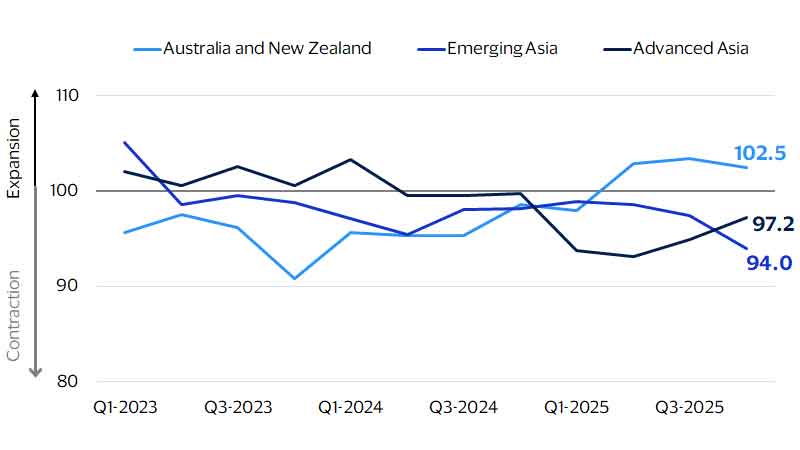
Visa’s Spending Momentum Index captured a strong rebound in spending in Australia and New Zealand as households reacted to falling interest rates. Meanwhile, spending in emerging Asia was resilient, as strong growth fundamentals and localized AI booms were offset by slower job creation and weakening performance in the traditional foreign direct investment (FDI)- and export-led engines of growth. Advanced Asia faced more headwinds, with declining real incomes in Japan (as inflation hit) and above-trend unemployment in Hong Kong, which encouraged more precautionary saving.
Spending Momentum Index
(Not seasonally adjusted; *≥100 = expansion, <100 = contraction. Last actual: Q4-2025)
Mixed momentum and outlook
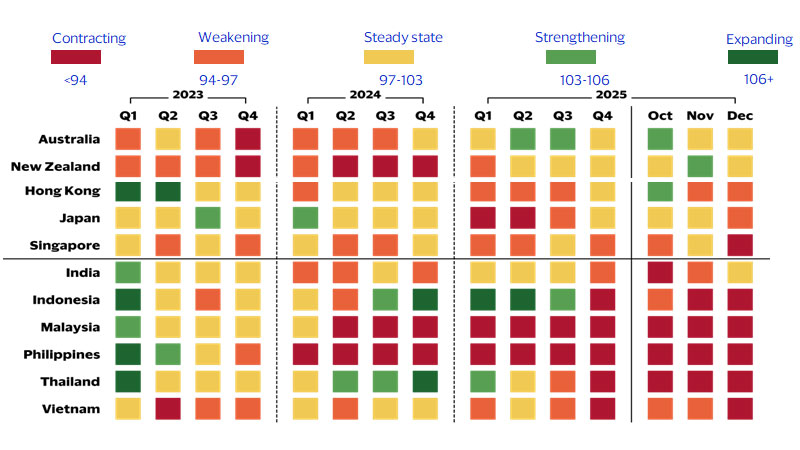
As 2025 came to a close, Visa’s models suggested that spending would continue to improve in Australia and NZ in early 2026 and stabilize in advanced Asia. Northeast Asia is shaping up to be a tale of two halves, with parts of the economy exposed to the AI hardware boom performing strongly, while the rest remains mostly lackluster.
Things are more challenging for emerging Asia, where we expect a growing divide. An emerging round of reforms in India will gradually give a boost to job creation, even as AI provides both opportunities and risks to its services sector. The trade powerhouse of Southeast Asia faces a hangover as inventory run-down in the United States will likely sap export demand, and policymakers in the U.S. look to take a tougher stance on trans-shipment of goods from Mainland China. As firms adjust to a more settled trade environment, we can expect further shifts in investment and employment.
Markets where governments are focused on growing domestic demand and continuing to improve the business environment, such as Vietnam, will be able to partially offset this and do well. By contrast, markets that have a shallower record of recent reforms, like Thailand and Indonesia, are more likely to see the tougher global backdrop reflected in weaker growth outcomes.
China’s economy showed resilience in 2025, as fiscal support and an AI boom held up growth. In 2026, ongoing headwinds from a stagnant property market and dampened job creation are expected to sustain the medium-term trend of moderating growth, though the world’s most powerful manufacturing base and further upside from technology should place a floor on growth.
Spending Momentum Index for Asia Pacific markets
(Not seasonally adjusted; *≥100 = expansion, <100 = contraction. Last actual: Q4-2025)
From travel boom to goods repricing
Three forces shaped category performance in 2025: further expansion of travel, rising affordability of goods as compared to services and rapid digitalization of public services. Travel was the standout. Spend at travel merchants grew around 2.5 times as fast as overall spending, even before taking into account what people buy in other categories, such as dining and entertainment, while traveling.
Retail goods and department stores also accelerated as consumers—fatigued from high services inflation—were drawn to cheap prices on offer for many goods categories. Falling wholesale prices, especially from Chinese manufacturers seeking new buyers, was also a factor behind weak home improvement spend, alongside a cyclical effect from projects that were brought forward during the pandemic. Fuel and automotive were muted, reflecting lower global oil prices and downward pressure on vehicle prices from heightened competition from Chinese manufacturers. The regional shift toward formalization of the economy and digital transformation of public services increased education and government spend, especially in India, Bangladesh, Indonesia, Philippines and Malaysia.
Online, all the time
Asia Pacific has long been a leader in e-commerce, with online payments penetration continuing to rise by slightly more than one percentage point in 2025. Signs of maturation are emerging, and in some categories, such as retail services, people are shifting back to in-person purchases. Online spend rose but relatively less so in healthcare, automotive, restaurants and entertainment.
The online market was especially hot in 2025 across three areas: Online travel agents gained share, even as agentic commerce raised the possibility of major structural shifts in buyer-seller relationships; goods retailers pivoted strongly online, with e-commerce growth accounting for 90 percent of the total increase; and e-government adoption also advanced. It is no coincidence that the categories that did best overall were also those that had the most dynamic online businesses. Department stores and apparel reached a symbolic milestone, with more than half of all sales now occurring online.
Cross-border growth outpaces domestic
Cross-border transactions made by Asia Pacific cards grew at more than double the rate of domestic ones, with particularly strong growth in travel, healthcare, food and drug, retail goods and restaurants. International e-commerce was particularly important for goods retail and home improvement. On the other hand, in-person tourism drove growth in retail services and healthcare. Department stores and apparel stood out as a rare segment that saw faster growth in domestic transactions. Total inbound B2B spend fell, as ongoing integration of regional supply chains was not enough to offset the reduced spend coming from B2B customers located outside of Asia Pacific.
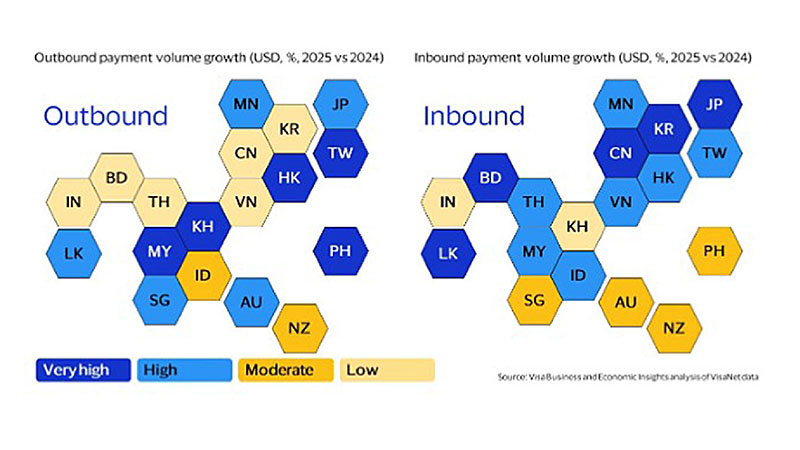
According to our analysis of Visa card spend, AP tourism grew by around 10 percent, with no major inbound market registering a decline in spend, while outbound spending again grew faster than nominal GDP across the region, albeit with more uneven performance. Cultural tourism loomed large: South Korea, with its ubiquitous pop stars, movies and cosmetics, leap-frogged Australia and Thailand to become the number two destination in the region, while the cultural pull of Mainland China supported its position as the fastest-growing inbound market. Japan remains the tourism giant; attracting more than double the spend of any other destination while also growing by more than 25 percent.
The profile of Asia Pacific’s most frequent travelers continues to evolve, with three trends standing out. First, economic growth does not always translate into increased travel. For many years, growing middle classes in Asia’s three giants of Mainland China, India and Indonesia translated into new visitors for everyone else, but this slowed in 2025 with factors such as rising unemployment and inequality affecting consumer confidence. Second, economies exposed to the AI investment boom generally saw more cashed-up tourists heading overseas; the Philippines, Taiwan, Malaysia and Singapore all saw robust increases. Finally, the sweet spot for attracting visitor spend lies in markets with a large base of affluent consumers, even if growth rates are moderate. More than three-quarters of new tourism spending by Asia Pacific cardholders came from residents living in Australia, Japan, Hong Kong, Singapore and Taiwan.
Hopping between hotspots
Consumer hopes, affluent reality
Long dependent on export-oriented manufacturing and trade for growth, Asia-Pacific economies faced a period of heightened anxiety among policymakers in early 2026 as trade policy upheavals intensified. Trade held up better than expected with some economies, notably Mainland China, generating record trade surpluses, and many exporters were initially reluctant to raise prices when faced with tariffs. New investments were put on hold until the regulatory environment settled. Meanwhile, some corridors of trade growth likely represented re-routing via third markets rather than new sources of growth. These factors will cause more B2B adjustment in 2026.
Many economies in the region will be looking to the consumer to offset any decline in net trade earnings. Ongoing urbanization and growing populations provide good fundamentals for emerging markets around the region, while the more developed economies are mostly well-positioned to continue to benefit from investments in AI. However, these fundamentals, particularly in the emerging markets, will now need to be matched by stronger domestic policymaking as external tailwinds weaken.
While the middle classes in some of the larger emerging economies are struggling, spending is still rising as buoyant asset markets support wealthier households. Affluent consumers—those holding premium Visa consumer cards—accounted for a disproportionate share of new spend in 2025, according to our analysis of anonymized VisaNet data. Their spending rose around three times faster in percentage terms than the non-affluent, contributing close to three-quarters of all new spending. Travel, entertainment and retail goods were the biggest beneficiaries. For some sectors that struggled overall, such as home improvement, automotive and fuel, affluent cards accounted for all the spending growth that did occur.
Looking ahead, Visa’s indicators point to continued improvement in Australia and New Zealand, stabilization across advanced Asia and a more mixed outlook in emerging Asia. Consumers are increasingly value-conscious and remain sensitive to interest-rate changes and job creation, but they continue to prioritize travel spend. For merchants, strong e-commerce and cross-border strategies are essential to capitalizing on the region’s future growth.
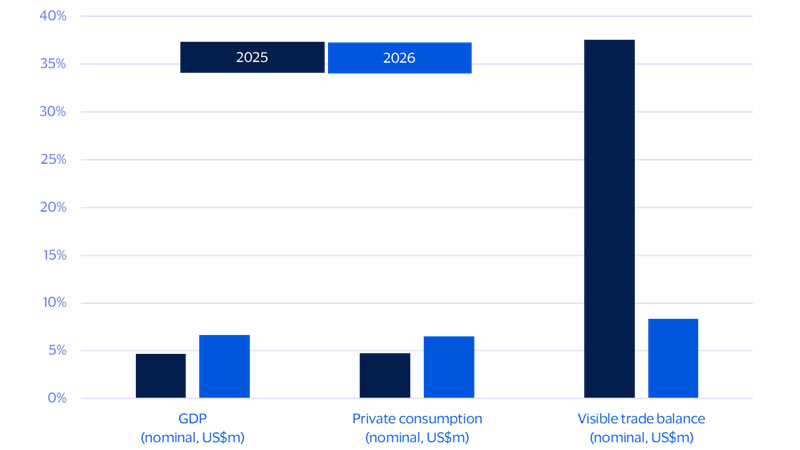
Asia Pacific’s GDP growth relied on trade in 2025, but private consumption will need to lift more in 2026
Year-on-year growth rates for a weighted aggregate of 24 Asia Pacific economies
Please download the report to view additional charts and forecast data.
Forward-Looking Statements
This report may contain forward-looking statements within the meaning of the U.S. Private Securities Litigation Reform Act of 1995. These statements are generally identified by words such as “outlook,” “forecast,” “projected,” “could,” “expects,” “will” and other similar expressions. Examples of such forward-looking statements include, but are not limited to, statements we make about Visa’s business, economic outlooks, population expansion and analyses. All statements other than statements of historical fact could be forward-looking statements, which speak only as of the date they are made, are not guarantees of future performance and are subject to certain risks, uncertainties and other factors, many of which are beyond our control and are difficult to predict. We describe risks and uncertainties that could cause actual results to differ materially from those expressed in, or implied by, any of these forward-looking statements in our filings with the SEC. Except as required by law, we do not intend to update or revise any forward-looking statements as a result of new information, future events or otherwise.
Disclaimers
The views, opinions, and/or estimates, as the case may be (“views”), expressed herein are those of the Visa Business and Economic Insights team and do not necessarily reflect those of Visa executive management or other Visa employees and affiliates. This presentation and content, including estimated economic forecasts, statistics, and indexes are intended for informational purposes only and should not be relied upon for operational, marketing, legal, technical, tax, financial or other advice and do not in any way reflect actual or forecasted Visa operational or financial performance. Visa neither makes any warranty or representation as to the completeness or accuracy of the views contained herein, nor assumes any liability or responsibility that may result from reliance on such views. These views are often based on current market conditions and are subject to change without notice.
Visa’s team of economists provide business and economic insights with up-to-date analysis on the latest trends in consumer spending and payments. Sign up today to receive their regular updates automatically via email.