Strong midyear global travel likely but destination mix may be changing

May 2023 – Consumer demand for international travel should remain solid through the peak 2023 global travel season—Northern Hemisphere’s summer months of June through August. International overnight arrivals are likely to rise above 325 million for the first time since 2019, with growth this season reaching the mid-teens relative to the same three months in 2022. However, where travelers choose to go this year is likely to change. Areas closed last year due to health regulations, such as Asia Pacific, have now re-opened. This summer, the growing backlog of unprocessed visa applications could be a more significant barrier. Travelers could end up by-passing places with more restrictive or cumbersome entry requirements in favor of those with more open policies.
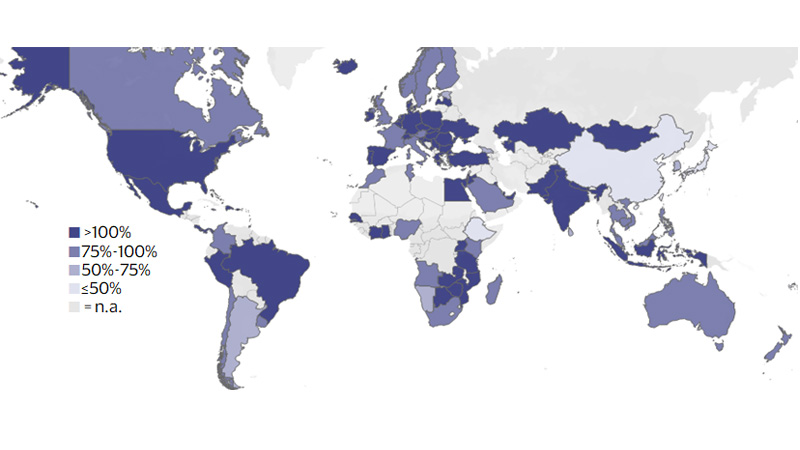
Global travel has steadily increased through 2023, priming the summer travel season for further gains. From January through April of this year, outbound travel from 63 out of the 113 countries covered by the Visa International Travel Platform¹ ran above their 2019 levels. This was a marked improvement from last season, where only 10 countries had recovered to this degree. An additional 95 countries have reached at least a 75 percent recovery rate, meaning most countries are near or have surpassed their 2019 levels.
Growth in outbound travel demand was strong for most countries in early 2023
(Monthly travel volumes from January-April 2023 relative to the same period in 2019)
Global travel’s growth capped by visa backlog
Compared to the last two summers, cross-border travel this summer faces more challenges due to global delays in the issuance of cross-border travel documents. Canada, for example, reported that at the end of March, only 54 percent of its temporary residence visa applications met its service standards, leaving nearly half a million people waiting longer than expected times.² Mexican citizens applying to travel to Canada have to wait 187 days for a visitor visa, against a service standard of 14 days.³ Canada is far from alone in this challenge. Potential visitors to the United States currently wait over 700 days for a required interview with U.S. consular staff at Bogota, Guadalajara or Mexico City.⁴ Some countries, such as Australia, have redoubled their efforts by hiring temporary staff to help clear the backlogs. As a result, half of all tourist visas are now processed within 10 days, down from 104 days at its peak in the second quarter of 2021.⁵
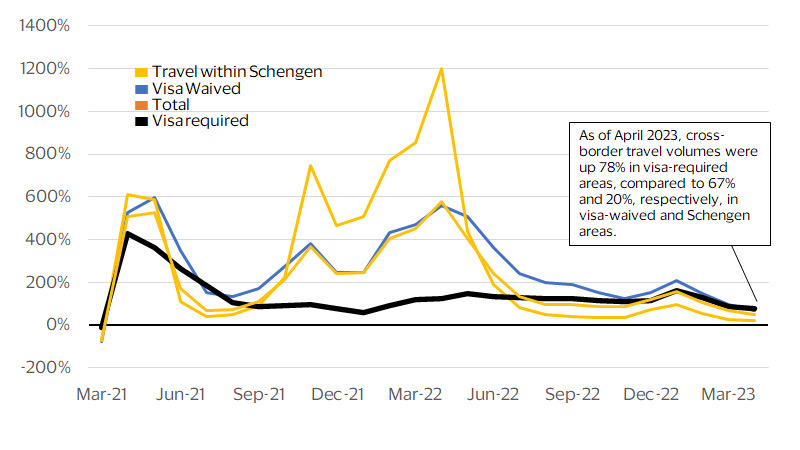
Documentation matters, when you consider that one-in-five trips prior to 2019 required a visa.
Global travel can be segmented into three large flows*:
- Travel that requires a visa by applying to the relevant national or consular authorities abroad (22%)
- Travel within Europe by citizens of states that are party to the Schengen Agreement (28%)
- Travel where visas requirements have been waived or granted on arrival (50%)
* Figures in parentheses correspond to the average share of each in total global travel, 2015-19
While travel within the Schengen Area and visa-waived corridors powered last year’s recovery, growth in both these flows has slowed in the first four months of this year. Slower consumer spending growth in North America and Europe relative to last year’s exceptional levels has contributed to a tapering of travel in these two flows. A stronger euro is further reducing travel within the Schengen Zone in favor of more inter-regional travel. The euro has appreciated in every month since last December, such that by April it is now 5 percent stronger compared to a broad basket of currencies. The one area of travel that lagged last year and has the potential to re-energize the industry is travel within corridors where visas are required. If travel in these corridors had matched its pre-2019 share levels, there would have been 31 million more visits globally in the first four months of this year. The slow return of Chinese travelers accounted for most of these missing visits, underscoring both the promise that China’s re-opening provides as well as the potential pitfalls ahead in driving more travel through these more restricted corridors.
Visa requirements are set to play a larger role in the summer of 2023
(Year-over-year percent change in monthly global cross-border travel volumes excluding Russia and Ukraine)
Frictions in travel dim long-term growth of the industry
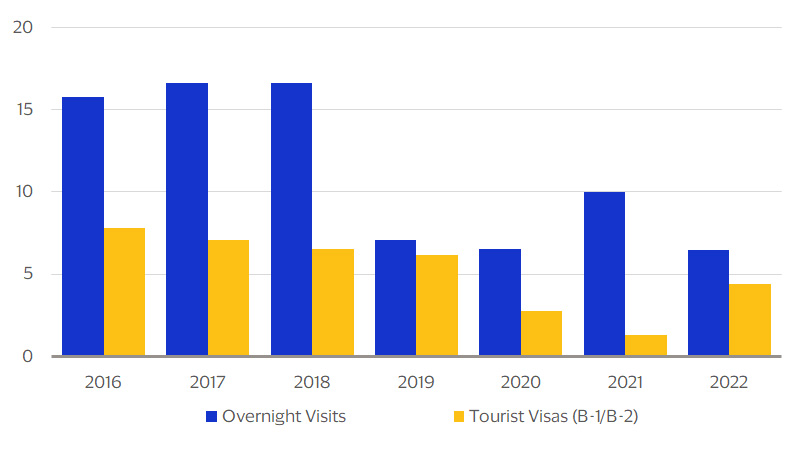
At first glance, the delays in travel document processing, while cumbersome at the individual level, may seem less impactful at a macro-level. In any given year in the United States, for example, the number of visas issued is less than the number of visits made by tourists from countries where visas are required. This is possible because once issued, U.S. visas are valid from three months to 10 years depending on a traveler’s nationality, and thus a good share of visits in any year are made most likely by repeat visitors.
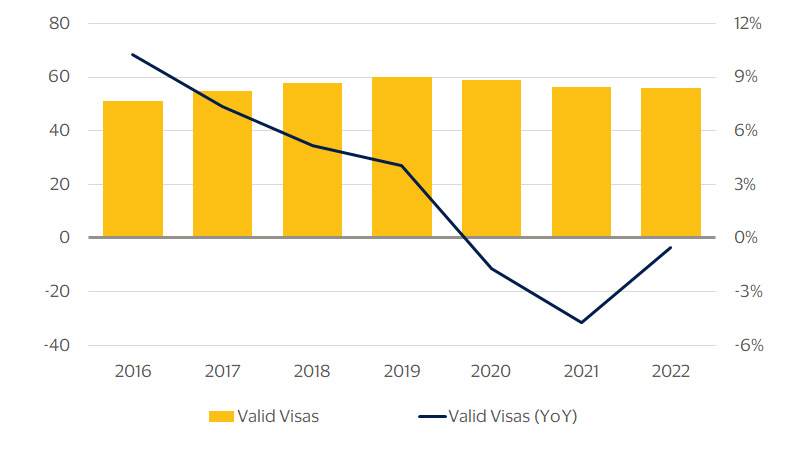
Even with the backlog and slowdown in visa processing over the past three years, the number of valid tourist visas to enter the United States could be as high as 56 million. Putting this figure into perspective, current valid visas could have covered nine times the volume of inbound visits in 2022 from countries where visas are required. In all likelihood, that coverage ratio will fall in 2023, especially as travel between China and the United States recovers, reducing the margin of valid visas to travelers. Thankfully, this increasing tightness should have less of an impact on the return of repeat Chinese tourists to the United States than other countries. Any of the 8 million or so Chinese citizens issued a U.S. tourist visa prior to 2020 most likely still has a valid visa, as the U.S. only started offering 10-year tourist visas to Chinese citizens in 2014 (previously renewed annually). However it could impact the arrival of Chinese citizens who have never been to the United States before.
U.S. visa issuance constrains less in short term
(Visits relative to visa issued during fiscal year, milions)
But could impact long-term development
(Estimated valid visas: millions, YoY percent change)
Places more open to travel have gained more visitors
Stronger recovery where visas are waived
(Growth in 2022 LAC arrivals relative to 2019 volumes, percent)
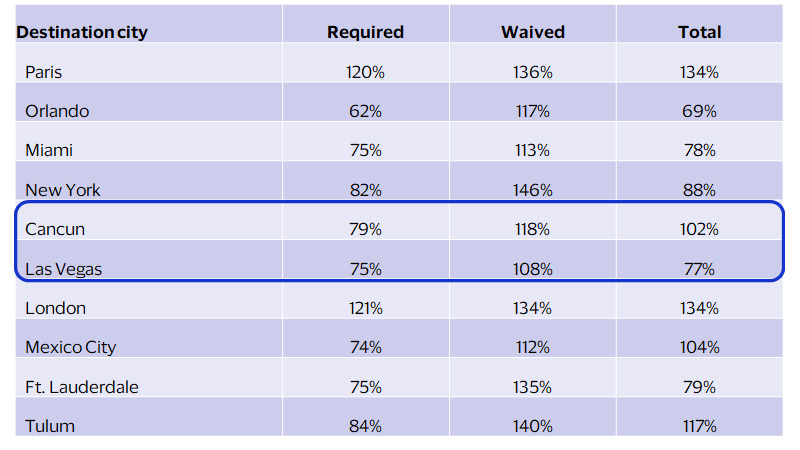
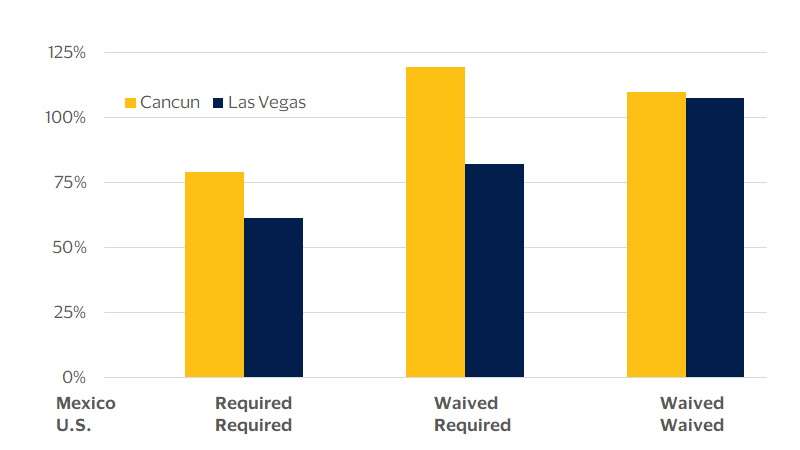
Cancun gained as visitors shifted to more open cities
(Growth in 2022 LAC arrivals relative to 2019, by visa requirements)
Stronger recovery where visas are waived
(Growth in Q1 ‘23 AP arrivals relative to Q1 ’19, percent)
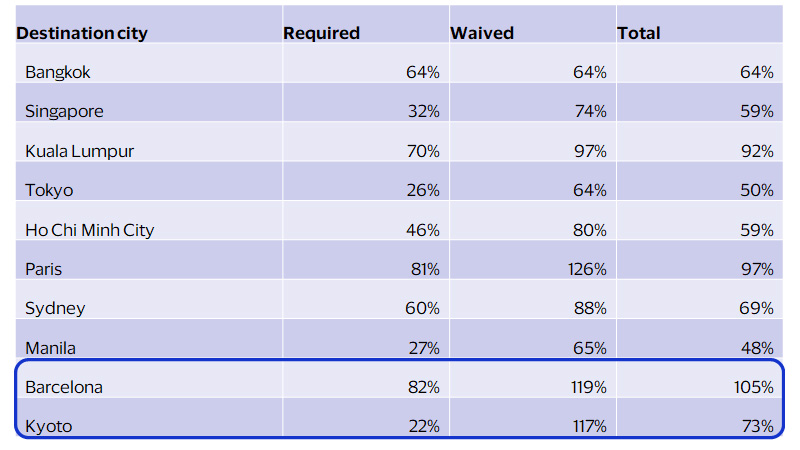
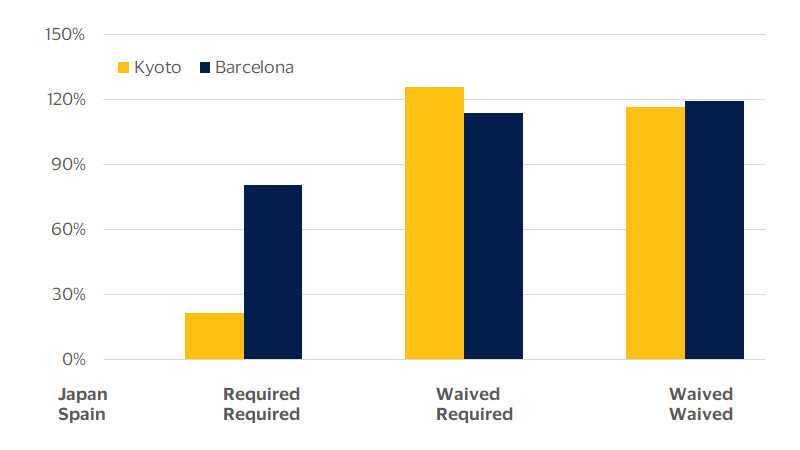
Kyoto’s gains from being more open were muted by geopolitics
(Growth in Q1 ‘23 AP arrivals relative to Q1 ’19, percent, by visa requirements)
Footnotes
- ¹The Visa International Travel (VISIT) platform is a proprietary model that combines Visa's cardholder data with publicly-available cross-border arrival statistics. Visa uses this data to econometrically model official arrival statistics compiled by various government sources and to generate estimates that fill in the large gaps existing in the cross-border travel data.
- ²Immigration Refugees and Citizenship Canada. https://www.canada.ca/en/immigration-refugees-citizenship/corporate/mandate/stronger-immigration-system.html (as of 5/16/2023)
- ³Immigration Refugees and Citizenship Canada. https://www.canada.ca/en/immigration-refugees-citizenship/services/application/check-processing-times.html (as of 5/16/2023)
- ⁴U.S. Department of State – Bureau of Consular Affairs. https://travel.state.gov/content/travel/en/us-visas/visa-information-resources/global-visa-wait-times.html (as of 5/16/2023)
- ⁵Australia Department of Home Affairs, Visitor Visa Program Report – June 2022 (https://www.homeaffairs.gov.au/research-and-statistics/statistics/visa-statistics/visit), and https://immi.homeaffairs.gov.au/visas/getting-a-visa/visa-processing-times/global-processing-times (as of 5/16/2023)
Forward Looking Statements
This report contains forward-looking statements within the meaning of the U.S. Private Securities Litigation Reform Act of 1995. These statements are generally identified by words such as “outlook,” “forecast,” “projected,” “could,” “expects,” “will” and other similar expressions. Examples of such forward-looking statements include, but are not limited to, statements we make about Visa’s business, economic outlooks, population expansion and analyses. All statements other than statements of historical fact could be forward-looking statements, which speak only as of the date they are made, are not guarantees of future performance and are subject to certain risks, uncertainties and other factors, many of which are beyond our control and are difficult to predict. We describe risks and uncertainties that could cause actual results to differ materially from those expressed in, or implied by, any of these forward-looking statements in our filings with the SEC. Except as required by law, we do not intend to update or revise any forward-looking statements as a result of new information, future events or otherwise.
Disclaimer
The views, opinions, and/or estimates, as the case may be (“views”), expressed herein are those of the Visa Business and Economic Insights team and do not necessarily reflect those of Visa executive management or other Visa employees and affiliates. This presentation and content, including estimated economic forecasts, statistics, and indexes are intended for informational purposes only and should not be relied upon for operational, marketing, legal, technical, tax, financial or other advice and do not in any way reflect actual or forecasted Visa operational or financial performance. Visa neither makes any warranty or representation as to the completeness or accuracy of the views contained herein, nor assumes any liability or responsibility that may result from reliance on such views. These views are often based on current market conditions and are subject to change without notice.