Signs of a turnaround in the outlook tempered by global uncertainty

January 2025 – The outlook for 2025 is mixed, with reason for both optimism and concern. Resilient labour markets, falling inflation, and lower interest rates are encouraging factors that give us hope for a cyclical turnaround in the coming 12 months. On the other end, geopolitical instability, an uncertain outlook for global trade, and fragile fiscal conditions in several European countries are all moderating factors we are monitoring as potential headwinds to growth.
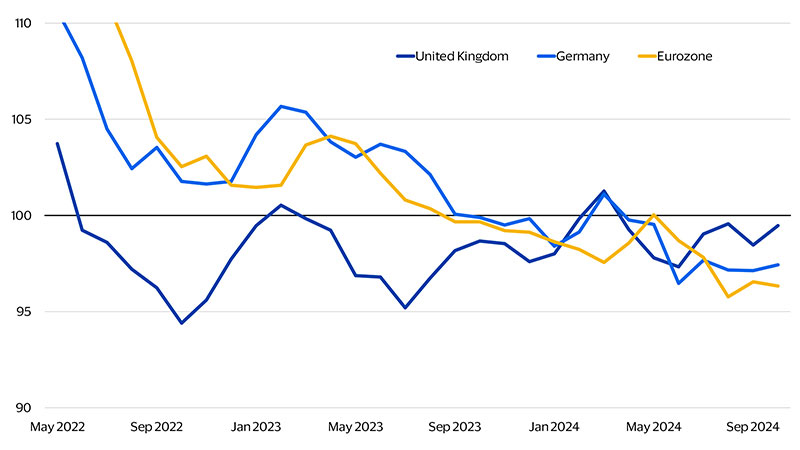
To understand the European economy's current trajectory, we reflect on the latter half of 2024. The recent disappointing performance of European consumer spending, as indicated by Visa's proprietary Spending Momentum Index (SMI), highlights the economic challenges faced in recent quarters. Despite what looked like favourable macroeconomic conditions, the European consumer gradually ran out of steam in the second half of the year. We believe this reflects the lingering effect of the surge in inflation and the resulting cost-of-living crisis in 2022-2023. This price jump compressed purchasing power and reduced household savings. Now, households are rebalancing their spending and rebuilding real savings, which is currently limiting economic growth. However, we are cautiously optimistic that this adjustment will lead to a gradual improvement in spending in 2025.
Visa Spending Momentum Index (SMI)
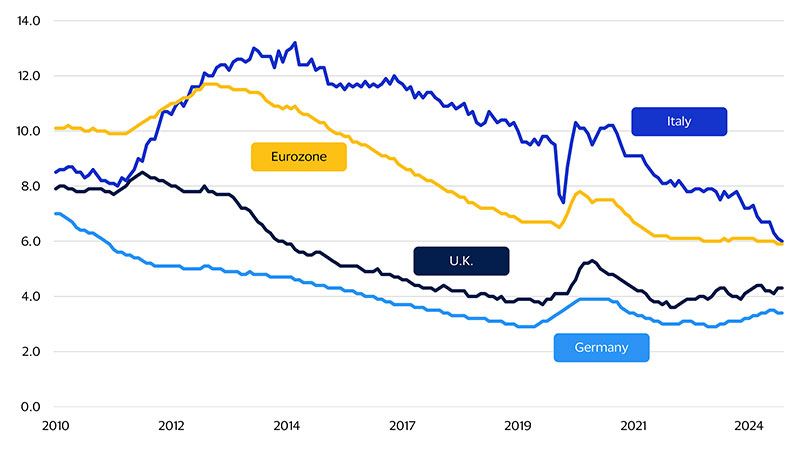
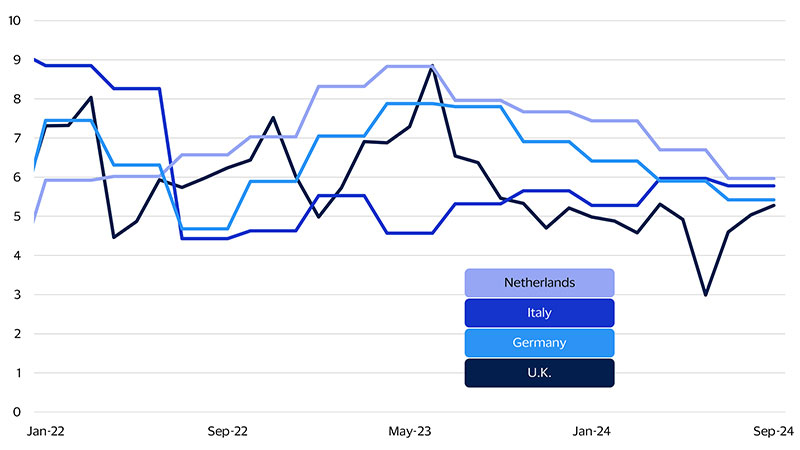
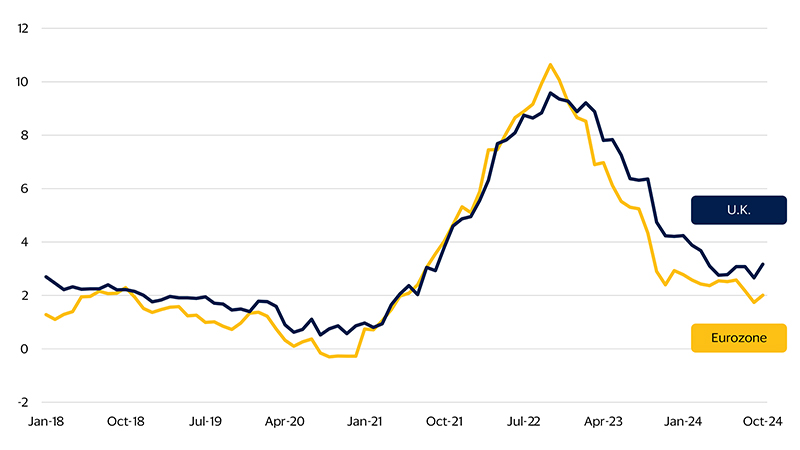
What factors will help Europe to regain momentum?
Unemployment rates
Wage growth
Inflation
Add to that the third positive development: Interest rates are slowly falling. Central banks have been cautious so far, a disappointment for those in financial markets expecting more aggressive rate cuts in 2024. But policy rates are coming down. The European Central Bank has delivered three rate cuts to a level of 3.25 percent, and the Bank of England cut rates twice to 3.75 percent. We expect the easing of financial conditions to remain slow and gradual throughout 2025, but eventually it will help revamp interest-sensitive sectors. Housing markets and small- to medium-sized businesses are most likely to benefit from easier access to credit and cheaper cost of financing.
These are the reasons why, on net, we are optimistic about economic healing in 2025 and beyond. But what are the risks to our relatively benign outlook for 2025?
Downside risks abound
Red Sea monthly average volume growth
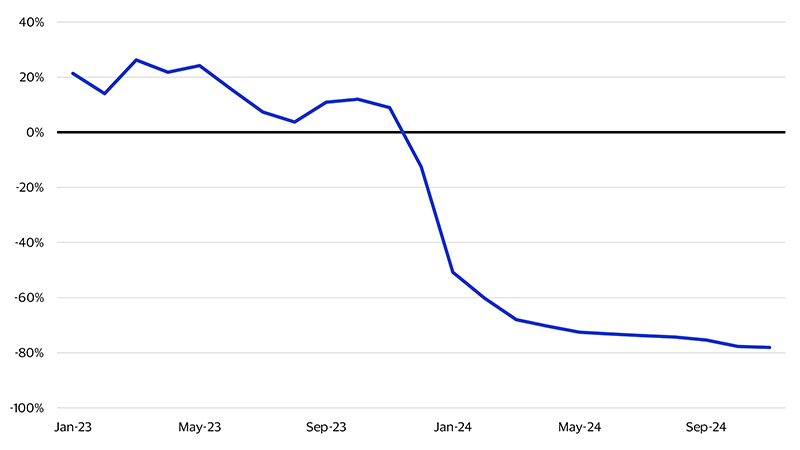
The more problematic matter is trade. European growth is heavily dependent on external demand. Exports account for more than 50 percent of the European economy, as measured by gross domestic product (GDP). With a new administration in the U.S., it is broadly anticipated that the global economic climate will evolve in a direction less favourable to free trade, and tariffs may become part of the U.S. policy mix. Even ruling out the most extreme scenarios, which could be crippling for European manufacturing, the region will likely face some targeted tariffs that will disproportionately impact vulnerable industries such as automotive, machinery, and specialty foods. This poses a major risk for countries specializing in these sectors, such as northern Italy, Germany, and smaller countries closely tied to the supply chain networks of large European manufacturers.
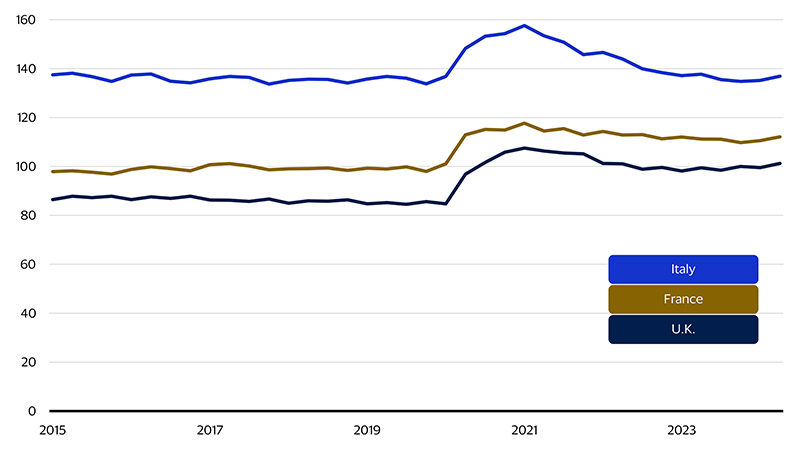
Our third concern is the sustainability of fiscal positions in Europe. Many countries are still grappling with the fiscal shock from the COVID pandemic. Debt, relative to the size of the economy, has risen in most countries, with the possible exception of Germany. The U.K. and France now find themselves in fiscal positions reminiscent of Italy and Spain years ago. Moreover, most governments are spending more than they collect in tax revenues, resulting in elevated fiscal deficits. This structural hardening is likely to create headwinds for the region in the coming years. Europe needs to rebalance its productive structures, shifting away from a heavy reliance on exports. While new engines of growth have yet to be identified, investment will be essential to successfully address these structural transformations. Given the limited fiscal space available, it is hard to envision how governments can play a positive role in this transition.
General government debt
Conclusions
So, what can we expect from European economies in 2025? We expect that global uncertainty will offset the gradual recovery of household balance sheets, ultimately weighing on growth. We now forecast growth to be between 1.0 percent and 1.5 percent in 2025. This is only a modest improvement compared to the estimated 0.8 percent GDP growth in 2024.
Overall, we do not foresee a surge in the unemployment rate or a dramatic deterioration in labour market conditions. However, it is likely that the number of jobless individuals will rise and wage growth will moderate somewhat. The fragile economic environment will help keep inflation in check, allowing central banks to continue easing interest rates and financial conditions.
All in all, the short-term balance of risks appears benign. What is more complicated is the medium-term outlook, which, in several cases, poses more structural challenges. In this regard, political and economic risks remain significant. With the new U.S. administration and March election in Germany, political developments could quickly lead to less favourable economic outcomes. As is often the case, political risks are a critical factor to watch when assessing the evolution of economic performance. Policymakers’ choices will be fundamental to how Europe responds to the structural woes weighing on the economy.
Macroeconomic forecasts for 2025
Percent change, year-on-year
Forward-Looking Statements
This report may contain forward-looking statements within the meaning of the U.S. Private Securities Litigation Reform Act of 1995. These statements are generally identified by words such as “outlook”, “forecast”, “projected”, “could”, “expects”, “will” and other similar expressions. Examples of such forward-looking statements include, but are not limited to, statements we make about Visa’s business, economic outlooks, population expansion and analyses. All statements other than statements of historical fact could be forward-looking statements, which speak only as of the date they are made, are not guarantees of future performance and are subject to certain risks, uncertainties and other factors, many of which are beyond our control and are difficult to predict. We describe risks and uncertainties that could cause actual results to differ materially from those expressed in, or implied by, any of these forward-looking statements in our filings with the SEC. Except as required by law, we do not intend to update or revise any forward-looking statements as a result of new information, future events or otherwise.
Disclaimers
The views, opinions, and/or estimates, as the case may be (“views”), expressed herein are those of the Visa Business and Economic Insights team and do not necessarily reflect those of Visa executive management or other Visa employees and affiliates. This presentation and content, including estimated economic forecasts, statistics, and indexes are intended for informational purposes only and should not be relied upon for operational, marketing, legal, technical, tax, financial or other advice and do not in any way reflect actual or forecasted Visa operational or financial performance. Visa neither makes any warranty or representation as to the completeness or accuracy of the views contained herein, nor assumes any liability or responsibility that may result from reliance on such views. These views are often based on current market conditions and are subject to change without notice.
Visa’s team of economists provide business and economic insights with up-to-date analysis on the latest trends in consumer spending and payments. Sign up today to receive their regular updates automatically via email.