Global Economic Insight
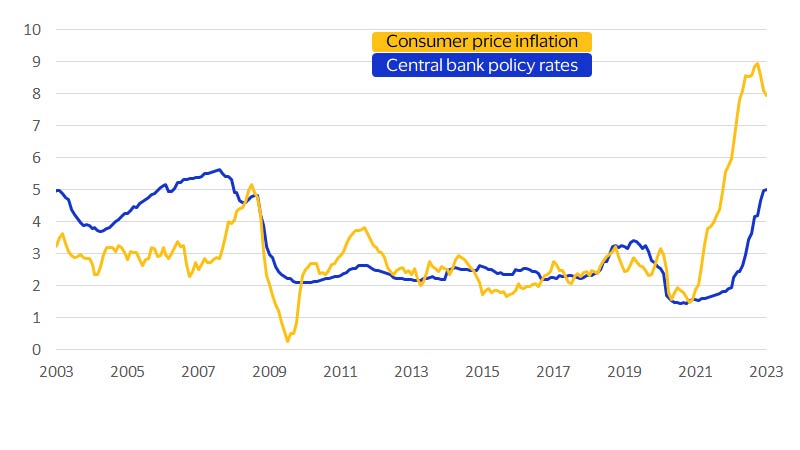
March 2023 – In early 2023, inflation appeared to be turning the corner globally—at least in 63 countries that account for more than 80 percent of total global consumer spending. However, efforts to curb inflation have faced a countervailing force that is becoming increasingly relevant post-pandemic: population aging. In January, the average inflation rate across the 63 countries on a consumer expenditure weighted basis fell back a full percentage point after peaking last September at 9 percent year-over-year (YoY). This progress follows a synchronous and rapid increase in interest rates, with central banks in all but two of these economies raising their policy rates. In aggregate, the weighted average central bank policy rate across these economies rose 3 percentage points to nearly 5 percent, the highest average rate since 2007.
At the same time, economies with older populations experienced a sharper spike in inflation than those with younger populations. Analysis leveraging the Visa Spending Momentum Index (SMI) reveals that, in U.S. cities with older populations, a shortage of workers due to retirement could be driving up inflation. This finding has important implications for market stability and growth. Using the SMI, cross-country comparative analysis across economies in North America, Europe and Asia Pacific indicates that an increase in inflation today impacts consumer discretionary spending much more than it did prior to the pandemic.
Global central bank policy rates and inflation
Weighted averages based on total consumer spending across 63 major economies, YoY percent
Inflation in 2022 ran hotter in areas with older populations
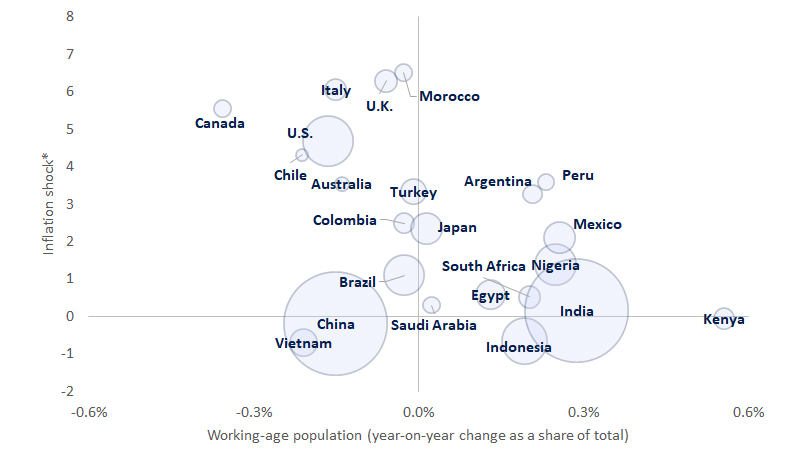
Supply chain disruptions, the energy crisis and the aftereffects of government stimulus programs all contributed to rising prices last year, but inflationary shock was much worse in markets with fewer working-age people.1 Without enough available workers, businesses in these areas were unable to ramp up capacity in response to surging demand. In regions with aging populations, such as Europe, the inflation rate could have been as much as 4 percentage points lower this year if their working-age populations had not declined. The chart below helps illustrate this trend in major economies around the world, showing that in countries where the working-age population declined, the inflation shock was greater, defined as the difference in 2022 inflation from 2000-2019 averages (measured in standard deviations). For example, where the working age population declined, such as Canada, the U.S. and Italy, the inflationary shock in 2022 was 6 to 8 standard deviations above the historical norms. In contrast, the working age populations in India and Indonesia increased as a share of total in 2022, and the increase in inflation was within historical ranges.
Looking ahead, demographic headwinds are likely to sustain elevated levels of consumer price inflation through the end of this decade. As the share of workers continues to decline in major economies, a higher proportion of the goods and services they produce will go towards current consumption, leaving less for savings and investment in future growth. If technological innovation does not compensate for the demographic drag, businesses are facing a decade of slower growth and lower returns on investment ahead.
Global inflation hit harder in areas where the working-age population declined
Share of working-age (15 to 64-year-old) people in total population vs. inflation rates in 2022
Graying labor force could keep prices elevated for longer
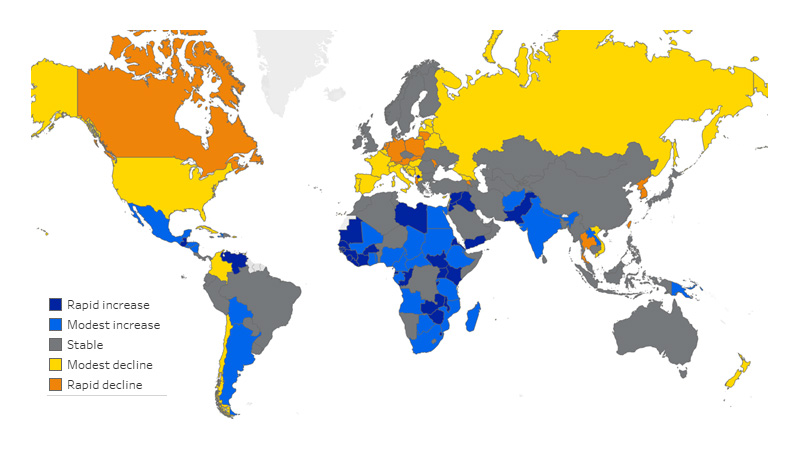
Demography need not be destiny when it comes to population aging and retirement, with many workers continuing to work into their later years. However, age remains the strongest predictor of workers leaving the workforce due to retirement. For example, researchers from the Bank for International Settlements found that inflation can be up to 0.4 percentage points higher for every worker out of 100 who ages out of the prime working-age group.² Conversely, countries with 1 percentage point more workers (as a share of the total) in their peak earning years enjoy about half a percentage point cooler inflation than they would have otherwise. The pandemic marked an inflection point where global demographics were no longer working to moderate inflation. Given the aging populations of the world’s largest economies—which together account for two-thirds of global output—their demographics have turned from a force mitigating inflationary pressures to one that will fan it further in the coming years.
Projected change in working-age populations as shares of total from 2022 to 2025
Retirements contribute to rising prices at the local level
A detailed look across major U.S. metros reveals prices have increased more where retirees make up a larger share of the resident population. Official data on inflation and retirement rates, coupled with Visa’s SMI as a measure of consumer demand, show that each percentage point increase in the share of retirees added 0.2 percentage points on average to local inflation. Up to one-third of the differences in observed inflation across major U.S. metro areas in 2022 were due to retirements. This finding is in keeping with what economists have long postulated. As the share of the retired population increases, fewer workers are available to support the provision of goods and services for the overall population; thus, inflation should increase. Taking the U.S. economy as an example, retirements alone have reduced U.S. domestic productive capacity by at least 2 percent relative to demand. This output loss could be even greater if the workers replacing them are not as experienced or productive, adding further to the upward pressure on prices this year.
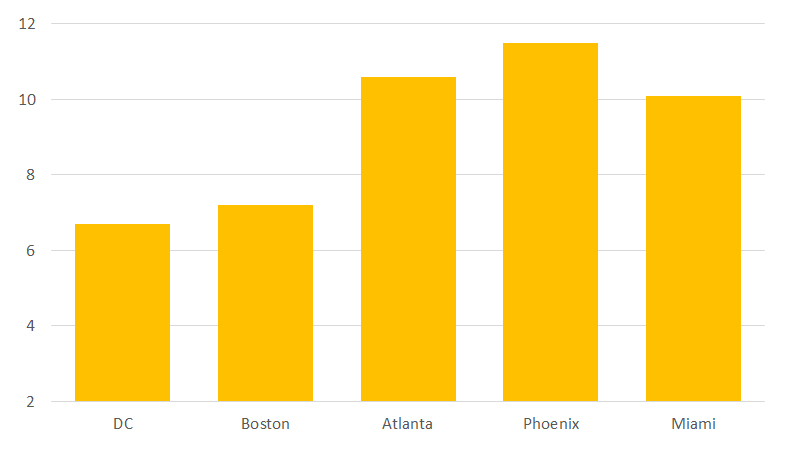
This might not seem important at the local level, as the goods consumers buy are often sourced from national and even international suppliers. However, local labor market dynamics are critical due to the simple fact that the average household in an advanced economy allocates most of its budget to services. In fact, U.S. households spend two out of every three dollars on services that are supplied locally in their communities, such as haircuts, medical services, education and housing. Consider the comparison between Boston and Phoenix, two metro areas where consumer spending has recovered to roughly the same extent, as measured by Visa’s SMI. Both have similar unemployment rates as well, averaging at around 3.1 percent in 2022. Yet the inflation rate in Phoenix, where retirees account for 18 percent of the resident adult population, was 4.3 percentage points higher than in Boston, with its more favorable worker-to-consumer ratio. On average, this pattern partially accounts for why inflation in cities like Miami has far exceeded national averages this year. Miami’s inflation rate is a full percentage point higher even compared to cities like Washington, D.C., where strong consumer demand is playing a bigger role in stoking local inflation.
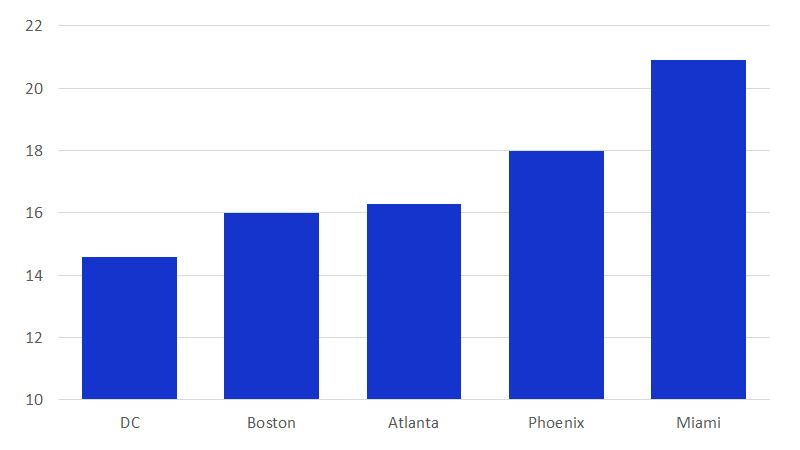
Annual consumer price inflation, by U.S. metro area (YoY percent, 2022)
Inflation presents as much risk to spending growth as unemployment
Whatever the underlying cause, persistent inflation presents significant medium-term risks to business. Inflation and unemployment are often treated as two sides of the same coin, bringing equal misery to consumers. Both erode the purchasing power of households and reduce their ability to maintain quality of life. Periods of high and persistent inflation are typically marked by declining revenues for merchants and lower transaction and purchase volume growth for issuers, particularly in discretionary categories of spending. Moreover, interest rate hikes by central banks in response to inflation further squeeze issuer profit margins and curtail business investment as credit conditions tighten and delinquencies rise.
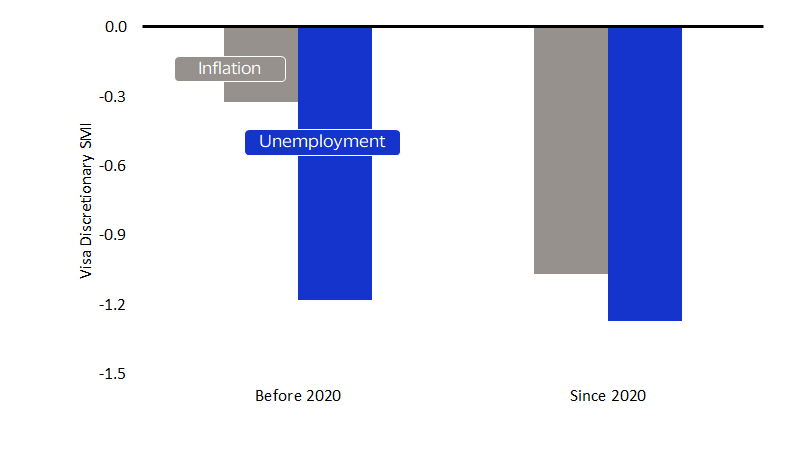
Inflation now rivals unemployment in its power to impede spending growth. Prior to 2020, each percentage point rise in the unemployment rate presented about three times as much drag on discretionary spending momentum as one percentage point increase in inflation. Since 2020, however, inflation’s effect on discretionary spending momentum has more than doubled to nearly match that of the unemployment.4 Based on this shift in inflation’s impact on spending, the surge in prices last year in Australia, Canada and the United Kingdom had as much of an impact on spending as if their unemployment rates had risen by as much as 3, 4 or 6 percentage points, respectively.
Impact of a 1 percentage point increase in inflation or unemployment on discretionary spending⁴
Footnotes
- Working age population is defined as population aged 15 to 64.
- Mikael Juselius and Elod Takats, “Can demography affect inflation and monetary policy?” BIS Working Papers, No. 485, 9 February 2015. https://www.bis.org/publ/work485.htm
- Based on counts of respondents who indicated “not employed or looking for work due to retirement” in the Current Population Survey.
- Estimates are based on panel regression analysis of quarterly data for eight markets around the world where SMI is available (United States, Canada, United Kingdom, Ireland, Australia, New Zealand, Italy and Brazil).
Forward-Looking Statements
This report may contain forward-looking statements within the meaning of the U.S. Private Securities Litigation Reform Art of 1995. These statements are generally identified by words such as “outlook”, “forecast”, “projected”, “could”, “expects”, “will” and other similar expressions. Examples of such forward-looking statements include, but are not limited to, statement we make about Visa’s business, economic outlooks, population expansion and analyses. All statements other than statements of historical fact could be forward-looking statements, which speak only as of the date they are made, are not guarantees of future performance and are subject to certain risks, uncertainties and other factors, many of which are beyond our control and are difficult to predict. We describe risks and uncertainties that could cause actual results to differ materially from those expressed in, or implied by, any of these forward-looking statements in our filings with the SEC. Expect as required by law, we do not intend to update or revise any forward-looking statements as a result of new information, future events or otherwise.
Disclaimer
The views, opinions, and/or estimates, as the case may be (“views”), expressed herein are those of the Visa Business and Economic Insights team and do not necessarily reflect those of Visa executive management or other Visa employees and affiliates. This presentation and content, including estimated economic forecasts, statistics, and indexes are intended for informational purposes only and should not be relied upon for operational, marketing, legal, technical, tax, financial or other advice and do not in any way reflect actual or forecasted Visa operational or financial performance. Visa neither makes any warranty or representation as to the completeness or accuracy of the views contained herein, nor assumes any liability or responsibility that may result from reliance on such views. These views are often based on current market conditions and are subject to change without notice.
Visa’s team of economists provide business and economic insights with up-to-date analysis on the latest trends in consumer spending and payments. Sign up today to receive their regular updates automatically via email.