TRAVEL AND CROSS BORDER Millennials on family vacations breathe new life into adventure parks

December 2025 – Mention millennials¹ and digital native, subscriptions for everything, and even avocado toast might come to mind. Family vacations may not be at the top of the list, but as more members of this generation start to have children they should be. Nearly 80 percent of all children under the age of 12 live in households today with at least one millennial parent, so how these families travel and what they expect out of their trips could be a key trend to watch for global travel and tourism providers.²
More than other generations, millennials prefer to spend their holidays relaxing at the beach. They also retain a bit of wanderlust from their younger years, looking to explore new, distant locations. At the same time, millennials with children strongly prefer destinations that offer physical activities.
While seemingly paradoxical to want to relax and have an activity-driven vacation, it’s very much in keeping with a key aspect of this generation: Millennials report being more time-pressed. This is more so for millennials with children. Seeking to decompress through more active leisure is a distinguishing feature of affluent workers. It is fitting then that millennials with children also report earning more but having less time for leisure.
With these demographic trends and challenges in place, adventure park tourism—typically involving more physical, participatory activities than a traditional amusement park—could have a bright future ahead. Why not take the family and kids on a vacation zip-lining through jungles, snorkeling among coral reefs, dunking in water parks, horseback riding on beaches or swimming with dolphins?
Visa Business and Economic Insights analysis of anonymized aggregated transactions on VisaNet indicates that vacations including a stop at an adventure park are gaining currency. In September, total spending on Visa credentials by domestic and foreign visitors at adventure parks was up 11 percent and 18 percent year-over-year (YoY), respectively.* For destinations, families visiting adventure parks have become an attractive demographic, especially for those destinations facing challenges with over tourism. Our data shows that visitors to adventure parks tend to be more affluent, spending 2-4 times more than the general population per year on their Visa credentials. A deeper analysis into North American visitors to adventure parks in Latin America and the Caribbean reveals that travelers who visit adventure parks stay longer in country, at four days on average, than those who don’t, at two days. Moreover, they spend up to four times as much as visitors who do not visit these parks as they seek to fill their trip with memorable experiences.
*Constant dollars, 12 months ending Sept-2025 vs. Sept-2024.
Millennials reaching the next milestone in life and finding time for the family
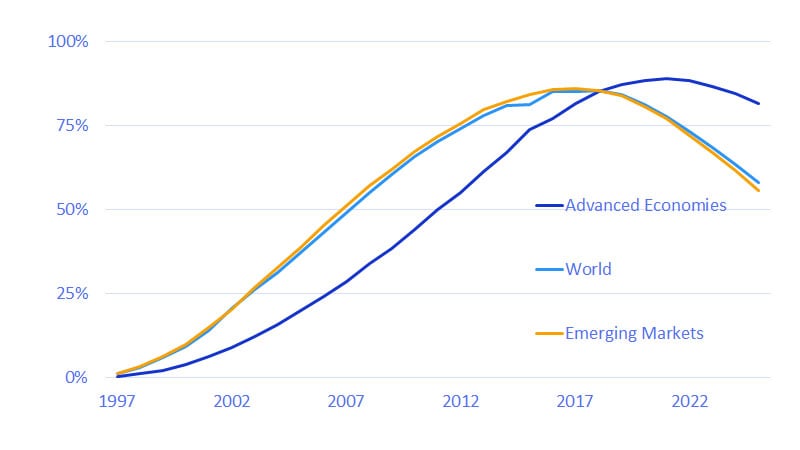
Millennials’ child raising takes off in the 2000s
Share of children born to millennial mothers (% of total)
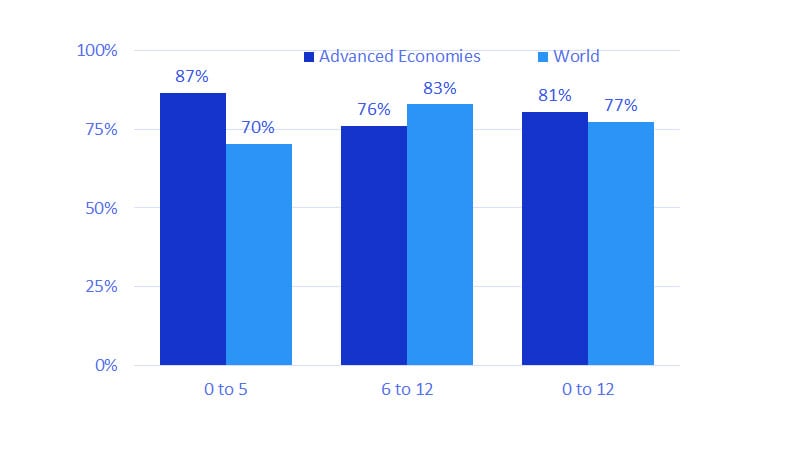
Most children live in households headed by millennials
(Millennials’ share of children by age and geography, % of total)
Adventure parks can be a great option for parents and kids, especially in millennial families
For parents short on time and looking for an active vacation, adventure parks have much to offer. Situated in great natural locations around the world, they can offer educational experiences through encounters with rare plants and animals, outdoor recreational activities and even cultural explorations. While some combine all the activities through one provider, in other cases a destination supports many small businesses. For travel providers, bundling or highlighting nearby adventure parks could enhance their appeal to this demographic.
VBEI analysis of anonymized and aggregated transaction data allows us to better track spending at adventure parks. Visitor spending at select parks located in Latin America and the Caribbean, Africa, the Middle East and Asia Pacific shows steady growth in park spending, with the amount spent by international visitors growing faster more recently than their domestic counterparts. In the year ending September 2025, international visitor spending in adventure parks was up 18 percent year-on-year (See Figure 4 in linked report.)
Transaction data provides valuable insights into adventure park visitors. Analysis across multiple countries reveals that these visitors are typically more affluent, spending significantly more per year on their Visa credentials than the general population. In fact, adventure park visitors outspend even cross-border travelers, who are themselves a high-spending group. For example, in Singapore, the median cardholder who traveled abroad between November 2024 and October 2025 spent twice as much as the median domestic spender, while those visiting adventure parks spent three times as much (See Figure 5 in linked report.) As a result, many destinations are enhancing their offerings to attract higher-spending visitors—a strategy increasingly used to address the challenges of over tourism by bringing in visitors more engaged and invested in destinations.
Combining transaction data with demographic information from third-party sources reveals that those who are visiting adventure parks are only a fraction of the potential market. For example, U.S. visitors who have visited an adventure park in Mexico, Jamaica and Costa Rica were only slightly more likely to be parents (at 77 percent of the total) as opposed to other visitors (68 percent). Additionally, the gap between those who have visited versus those who have not is much wider by generation, with 47 percent of those who visited the parks being millennials as opposed to 36 percent of those who did not. Marketing outreach to millennials with children could help to attract more visitors to the parks and lodging and other small businesses adjacent to them. For issuers, partnering with adventure parks could be a means to deepening connections with this key customer segment.
Trips involving adventure parks can yield strong returns to destinations
We found that adventure park tourists are more engaged and spend significantly more time at their destinations than other cross-border travelers. Our analysis focused on North American cardholders who visited Mexico, Costa Rica, and Jamaica over the past year. For each cardholder, we identified trips by tracking the first and last day their card was used in each country. This method allowed us to treat each trip separately—so, for example, if a traveler visited Mexico multiple times in a year, each adventure park visit was analyzed as a distinct trip.
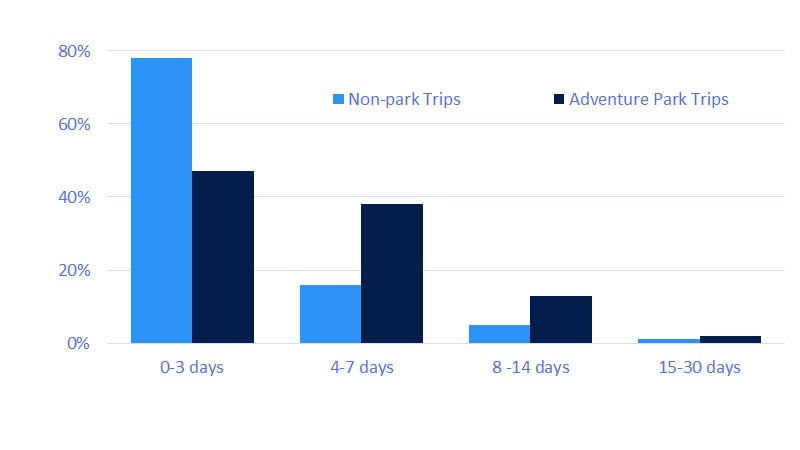
The data revealed that trips including an adventure park visit averaged four days—twice as long as other North American travelers’ trips—and generally lasted longer than the typical visit (chart below). Not only did these travelers stay longer, but they also spent nearly three times more in-person at their destinations. Moreover, adventure park trips were more experience-focused, with travelers prioritizing immersive activities over other types of visits.
Trips that include adventure park visits tend to be longer in duration
Distribution of trips by duration and type (% of total)
As the year-end approaches and spring and summer holidays become top of the mind, adventure parks that offer a little bit of everything for everyone in the family could be strong vacation options in 2026. For millennial families, including adventure parks in the itinerary could open up new experiences in distant lands while also offering a wide range of activities. Such trips could also appeal to their preference for active leisure given their typically busy work and household schedules.
For destinations, VBEI analysis shows that visits including adventure parks attract higher-spending travelers who will stay longer in destinations as they seek to build memories through unique experiences. These travelers can help to even out some of the stresses that are placed on destinations more accustomed to shorter-term visits that involve less engagement by the traveler.
Footnotes
- Millennials in this report are defined as those born between 1982 to 1999.
- VBEI analysis of data from the United Nations, Department of Economic and Social Affairs, Population Division (2024), World Population Prospects 2024, published July 2024.
- VBEI analysis of data from the United Nations, Department of Economic and Social Affairs, Population Division (2024), World Population Prospects 2024, published July 2024.
- VBEI analysis of data from the You Gov, Global Profiles, October 29, 2025.
Forward-Looking Statements
This report may contain forward-looking statements within the meaning of the U.S. Private Securities Litigation Reform Act of 1995. These statements are generally identified by words such as “outlook,” “forecast,” “projected,” “could,” “expects,” “will” and other similar expressions. Examples of such forward-looking statements include, but are not limited to, statements we make about Visa’s business, economic outlooks, population expansion and analyses. All statements other than statements of historical fact could be forward-looking statements, which speak only as of the date they are made, are not guarantees of future performance and are subject to certain risks, uncertainties and other factors, many of which are beyond our control and are difficult to predict. We describe risks and uncertainties that could cause actual results to differ materially from those expressed in, or implied by, any of these forward-looking statements in our filings with the SEC. Except as required by law, we do not intend to update or revise any forward-looking statements as a result of new information, future events or otherwise.
Disclaimers
The views, opinions, and/or estimates, as the case may be (“views”), expressed herein are those of the Visa Business and Economic Insights team and do not necessarily reflect those of Visa executive management or other Visa employees and affiliates. This presentation and content, including estimated economic forecasts, statistics, and indexes are intended for informational purposes only and should not be relied upon for operational, marketing, legal, technical, tax, financial or other advice and do not in any way reflect actual or forecasted Visa operational or financial performance. Visa neither makes any warranty or representation as to the completeness or accuracy of the views contained herein, nor assumes any liability or responsibility that may result from reliance on such views. These views are often based on current market conditions and are subject to change without notice.
Visa’s team of economists provide business and economic insights with up-to-date analysis on the latest trends in consumer spending and payments. Sign up today to receive their regular updates automatically via email.