All aboard! Luxury train travel gains traction with cross-border travelers

March 2025 – Looking to immerse yourself in the majestic Canadian Rockies, explore Incan ruins in the Andes, or relive the romance of an Agatha Christie novel? A train journey may be just the ticket. More than a relic of bygone days, train tours have recently surged in popularity, suggesting that a renaissance in rail travel may be in the making.
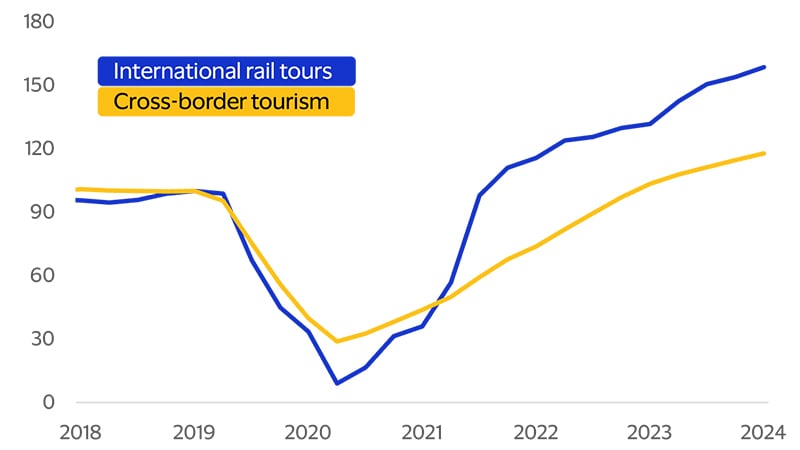
Demand for international train journeys has outpaced total cross-border tourism spending, according to Visa Business and Economic Insights analysis of aggregated transaction spending across more than two dozen rail companies and travel agencies specializing in rail travel. From 2019 through 2024, travelers’ cross-border spending worldwide on rail tours rose 59 percent, compared to 18 percent in total cross-border tourism spending (see figure below). The success of rail journeys tracks with a rise in affluent, older travelers seeking both comfort and convenience to explore the world.
Spending by cross-border travelers on rail tours rebounded faster than the market as a whole
(Cross-border spending, four quarter moving average, 2019 = 100)
Mind the gap: Train travel boosts a country’s appeal
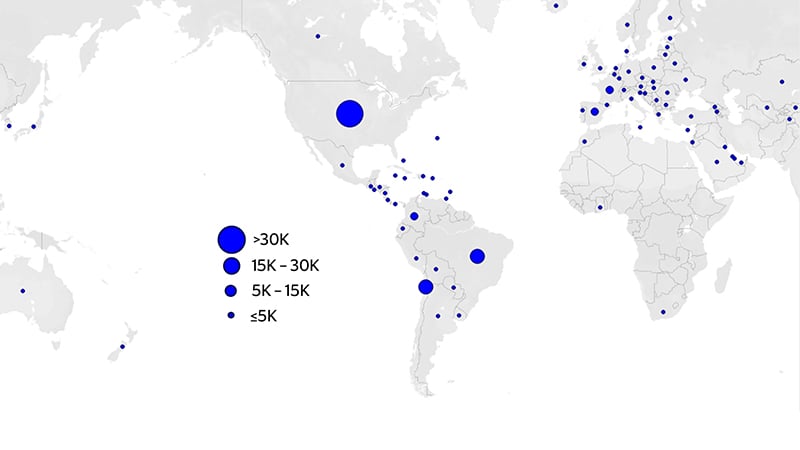
Train journeys in the Western Hemisphere are popular with visitors from around the world
(Estimated number of rail tour travelers by country of origin)
Full steam ahead: Spending more when traveling by train
Staying on track: Rail travel boosts spending in local economies
The train experience could cover long distances and reach multiple locations
(Distance in miles vs. number of stations along the way)
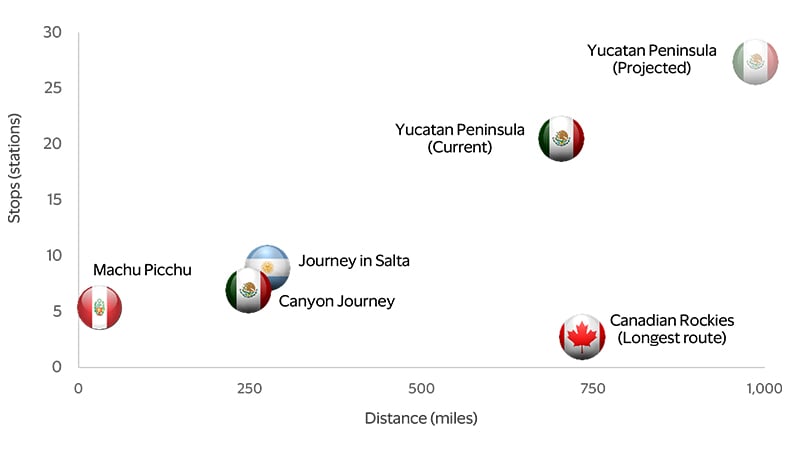
Consider, for example, Tren Maya, the latest addition to the list of routes covered, which has expanded travelers’ options to visit the Yucatan peninsula in Mexico. On average, these tourists visited seven destinations in Mexico in 2024, as opposed to only three destinations for those who did not travel this route. Ranked in order of number of visitors, the top three destinations in 2024 for those who traveled along this train route were Mexico City, Merida and Cancun. For visitors to Mexico who did not take the train, their most-visited destinations were Mexico City, Cancun and Playa de Carmen. Beyond the top cities, visitors riding Tren Maya now have easier access to the historical and cultural riches that were previously harder to access in Valladolid, Progreso, Palenque and Campeche.
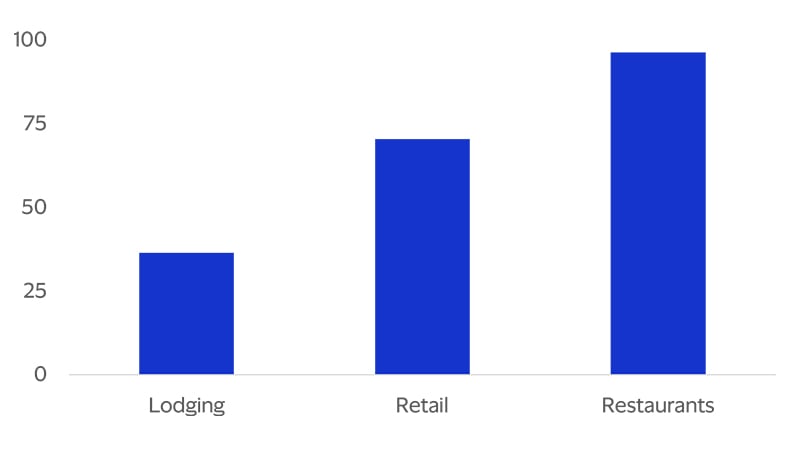
Overall, train travelers end up spending more on transportation, lodging, retail, and restaurants than non-train travelers. It’s possible that some non-train travelers may have already paid in advance for related services through all-inclusive packages. However, the significantly higher spending by card among train travelers in the main categories associated with tourism (see figure below), combined with their tendency to visit more (and sometimes remote) locations, may play a key role in developing an ecosystem of local services. In this regard, not only could rail-related tourist attractions help bring payments to more geographies, but also to a variety of service activities.
Train travelers spent more in main categories than non-train visitors
(Additional spending by card, percent difference of train traveler spending vs. non-train visitors)
Forward-Looking Statements
This report may contain forward-looking statements within the meaning of the U.S. Private Securities Litigation Reform Act of 1995. These statements are generally identified by words such as “outlook”, “forecast”, “projected”, “could”, “expects”, “will” and other similar expressions. Examples of such forward-looking statements include, but are not limited to, statements we make about Visa’s business, economic outlooks, population expansion and analyses. All statements other than statements of historical fact could be forward-looking statements, which speak only as of the date they are made, are not guarantees of future performance and are subject to certain risks, uncertainties and other factors, many of which are beyond our control and are difficult to predict. We describe risks and uncertainties that could cause actual results to differ materially from those expressed in, or implied by, any of these forward-looking statements in our filings with the SEC. Except as required by law, we do not intend to update or revise any forward-looking statements as a result of new information, future events or otherwise.
Disclaimers
The views, opinions, and/or estimates, as the case may be (“views”), expressed herein are those of the Visa Business and Economic Insights team and do not necessarily reflect those of Visa executive management or other Visa employees and affiliates. This presentation and content, including estimated economic forecasts, statistics, and indexes are intended for informational purposes only and should not be relied upon for operational, marketing, legal, technical, tax, financial or other advice and do not in any way reflect actual or forecasted Visa operational or financial performance. Visa neither makes any warranty or representation as to the completeness or accuracy of the views contained herein, nor assumes any liability or responsibility that may result from reliance on such views. These views are often based on current market conditions and are subject to change without notice.
Visa’s team of economists provide business and economic insights with up-to-date analysis on the latest trends in consumer spending and payments. Sign up today to receive their regular updates automatically via email.