Customer segmentation Luxury shopping is no longer just for the affluent

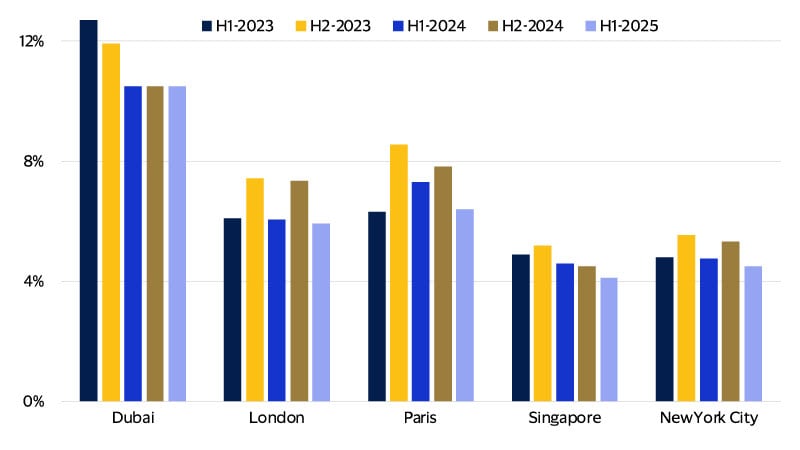
November 2025 – As the holiday season approaches, banks and premium luxury brands face a pivotal moment in a market defined by contradiction. While the glamour and allure of luxury goods remain, Visa data shows the pace of buying has slowed amid global economic uncertainty: In the first half of 2025, participation in luxury retail spending decelerated across major global centers (see figure below). This marks the first decline in the luxury industry since the financial crisis of 2008, excluding the COVID-19 shock in 2020. However, a recent Visa Business and Economic Insights (VBEI) analysis of domestic cardholder activity in luxury shopping hotspots including Dubai, London, Paris, Singapore, and New York City reveals a complicated spending picture.
Despite the recent slowdown, consumers across spending tiers are still engaging with high-end goods, indicating that luxury retail is no longer just for the top 1 percent of spenders. VBEI found that those among the top 5, 10, and even 20 percent of spenders are indulging in these purchases. With 300 million Gen Z and Gen Alpha consumers poised to enter the market and digital shopping reshaping how luxury goods are discovered and purchased, brands that embrace innovation and personalization can attract this expanding universe of luxury retail shoppers. We also anticipate an uptick in participation leading up to the holiday season—a critical window of opportunity for capturing consumer attention and loyalty.
Consumer participation* in luxury retail spending slowed in H1-2025
Percentage of resident cardholders making premium luxury retail purchases, by city
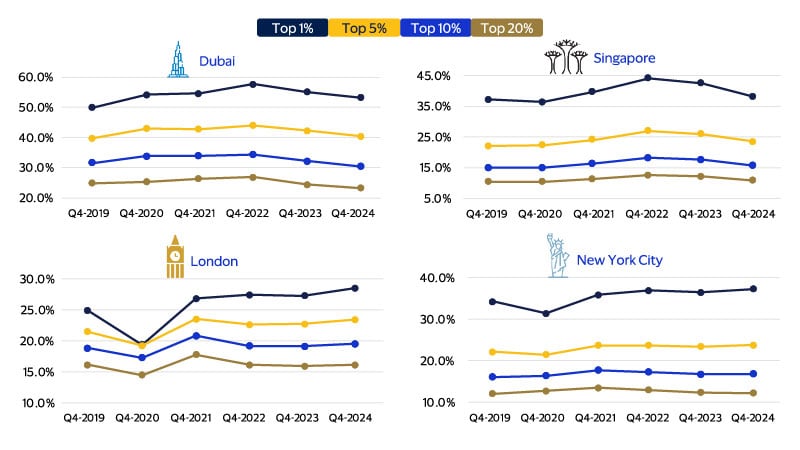
Luxury spending extends beyond just the top 1 percent
While premium luxury spending is often associated with the ultra-wealthy, it is not solely the domain of the top 1 percent of spenders. In fact, the top 5 percent, 10 percent, and even 20 percent of spenders also indulge in luxury purchases, albeit at lower rates than the top 1 percent (see figure below). For many in the middle class, premium luxury goods are an aspirational goal, representing both achievement and self-expression.
A better-than-expected global economic outturn in 2023 led to wider participation in luxury spending in Q4-2023, as more consumers across different spending segments engaged with high-end brands. However, escalating tariff threats and heightened trade uncertainty contributed to a general pullback in participation rates across all segments in Q4-2024 in Dubai and Singapore. In London and New York, participation rates in luxury spending for the top 1 percent and top 5 percent rose, while other segments remained somewhat flat. Despite this general slowdown, participation rates remained broadly in line with Q4-2019 levels, indicating that the Q4-2024 pullback was modest and luxury spending continues to be broad-based. After all, participation in spending is the most important factor behind sales growth. It's not about a few people spending more, but about more people choosing to buy. In fact, around 80 percent of sales growth comes from an increase in customers, not transaction sizes.¹
The appeal of premium luxury extends beyond the top 1 percent, attracting a more diverse group of spenders
Percentage of cardholders making premium luxury purchases, by cardholder spend band
Looking ahead, the long-term outlook for the luxury industry remains robust despite current volatility. Over the next five years, more than 300 million new consumers—many from Gen Z and Gen Alpha—are expected to enter the market, fueling fresh demand. This expansion will be underpinned by rising global incomes, generational wealth transfers, and a projected 20 percent increase in high-net-worth individuals, all of which are set to further broaden the base of potential luxury buyers and reinforce the industry’s growth prospects.²
Capturing this diverse client base may require bank issuers to look beyond the ultra-wealthy and to develop card products, rewards, and marketing campaigns that appeal to the top 5–20 percent of spenders and aspirational middle-class consumers. By leveraging transaction data, issuers can identify emerging luxury buyers and deliver personalized offers—such as invitations to exclusive events, tailored concierge services, or unique brand collaborations—to deepen engagement and loyalty. Brands have an opportunity to capture the broadening luxury audience by developing marketing strategies and product offerings that appeal to aspirational middle-class consumers, such as entry-level luxury items or limited editions, while maintaining brand exclusivity. Inclusive, tiered loyalty programs can help reward both established high spenders and those new to luxury, fostering long-term relationships.
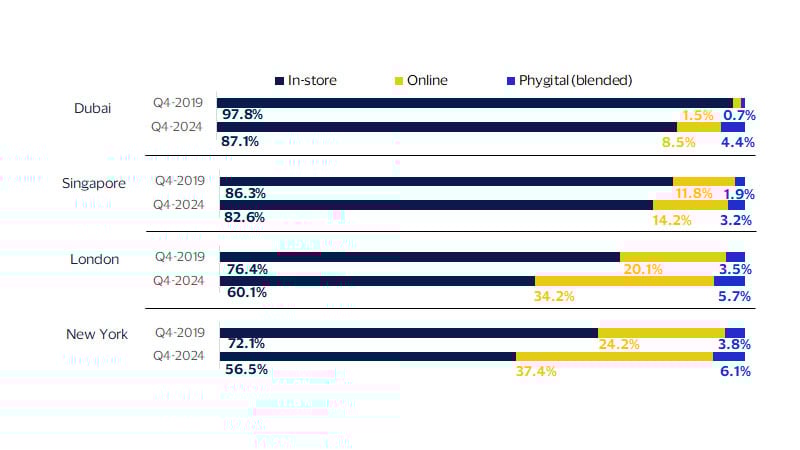
Luxury retail spending goes digital
Luxury consumer goods remain dominated by in-store spending. Affluent shoppers continue to seek out the in-person shopping experience, with personalized service and the exclusive atmosphere that physical boutiques offer. Flagship stores serve not just as points of sale, but as a fully immersive brand destinations. Having said that, however, consumers are becoming more comfortable spending online on premium luxury goods globally. Online premium luxury sales have picked up in recent years, while ‘phygital’ experiences that combine e-commerce and in-store have also increased. Luxury brands are leading the way in phygital innovation by blending immersive in-store experiences with digital enhancements such as interactive boutiques, live online shopping, integrated social media apps for personalized rewards, AR virtual try-ons and connected store technology. Such enhancements all exemplify how the sector is redefining luxury retail for the digital age.(3, 4, 5)
An analysis of the composition of cardholder spending on luxury goods reflects a notable shift in the past five years. The cardholders were classified into three major groups: cardholders who only spend on luxury in-store, cardholders who only spend online, and cardholders who spend on a combination of in-store and online (a proxy for blended shopping experiences). Across the five major cities, online and blended shopping experiences gained ground – though overall in-store spending still dominates (see figure below). Most notably, London, New York City and Dubai saw the combined share of e-commerce and blended luxury spending from Q4-2019 to Q4-2024 rise by 16.3, 15.6 and 10.7 percentage points, respectively. This reflects a profound shift in luxury consumers’ willingness to embrace digital channels and phygital retail experiences, driven by evolving shopping preferences, greater digital engagement, and the pandemic’s lasting impact on purchasing behavior.
While in-store luxury experiences still dominate, share of online and phygital spending have gained ground
Composition of consumer spending on premium luxury goods by mode of payment
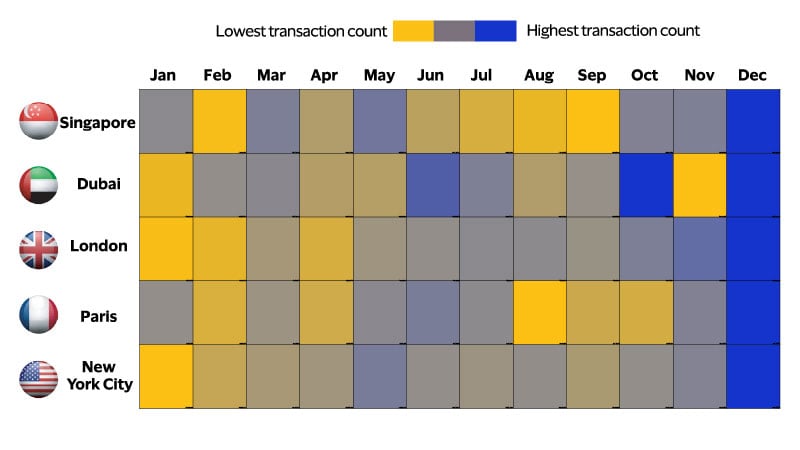
Luxury spending peaks in December
December is universally the busiest month for premium luxury spend
Heatmap of busiest months in 2024 by transaction count for consumer cardholders in premium luxury spending
*For purposes of this study, the consumer participation rate is defined as the share of domestic cards with at least one transaction within a three-month window among the top 22 global consumer luxury brands.
Footnotes
- Einav, Liran, Klenow, Peter J., Levin, Jonathan D., & Murciano-Goroff, Raviv. (2022). Customers and Retail Growth. Stanford University.
- Bain & Company. (2025, June 20). Luxury confronts slowdown amid economic headwinds and market disruptions, while industry resilience and strong fundamentals underpin future prospects
- LUXXU. (2020, June 18). Gucci Live: A new luxury shopping experience
- TheIndustry.fashion. (2020, August 5). Inside Burberry’s trailblazing social retail store
- WANNA. (2022, November 30). Virtual try-on technology for luxury industry
Forward-Looking Statements
This report may contain forward-looking statements within the meaning of the U.S. Private Securities Litigation Reform Act of 1995. These statements are generally identified by words such as “outlook”, “forecast”, “projected”, “could”, “expects”, “will” and other similar expressions. Examples of such forward-looking statements include, but are not limited to, statements we make about Visa’s business, economic outlooks, population expansion and analyses. All statements other than statements of historical fact could be forward-looking statements, which speak only as of the date they are made, are not guarantees of future performance and are subject to certain risks, uncertainties and other factors, many of which are beyond our control and are difficult to predict. We describe risks and uncertainties that could cause actual results to differ materially from those expressed in, or implied by, any of these forward-looking statements in our filings with the SEC. Except as required by law, we do not intend to update or revise any forward-looking statements as a result of new information, future events or otherwise.
Disclaimers
The views, opinions, and/or estimates, as the case may be (“views”), expressed herein are those of the Visa Business and Economic Insights team and do not necessarily reflect those of Visa executive management or other Visa employees and affiliates. This presentation and content, including estimated economic forecasts, statistics, and indexes are intended for informational purposes only and should not be relied upon for operational, marketing, legal, technical, tax, financial or other advice and do not in any way reflect actual or forecasted Visa operational or financial performance. Visa neither makes any warranty or representation as to the completeness or accuracy of the views contained herein, nor assumes any liability or responsibility that may result from reliance on such views. These views are often based on current market conditions and are subject to change without notice.
Visa’s team of economists provide business and economic insights with up-to-date analysis on the latest trends in consumer spending and payments. Sign up today to receive their regular updates automatically via email.