Economic outlook and forecasts Latin America’s economy is resilient, but stories diverge

November 2025 – Economic narratives play a key role in decision-making. However, high uncertainty and biases can cloud the picture. We rely on hard and soft data, historical evidence, and local insights to build a narrative of regional resilience with varied exposure to global trade, immigration, and geopolitics. Recent data confirms that Latin America’s economic story in 2025 is a mixed bag, but growth is happening across the board with household consumption leading the way in most countries. Low inflation and interest rates are playing out favorably in the region. Estimated regional GDP growth remains at 2 percent.
Brazil is cooling after a farm-driven boost, with investment and government spending slowing, though consumer spending and exports remain resilient. High interest rates and weak job growth weigh on momentum. Mexico is nearly stagnant due to weak demand and U.S. policy exposure. In Central America and the Caribbean, Costa Rica and Guatemala’s economies grow steadily, while Panama and the Dominican Republic slow amid trade and tourism headwinds. The Andean region benefits from low inflation and interest rates, with consumption growing in Colombia and Ecuador, while Peru slows. Argentina’s economic recovery continues but momentum has been fading; meanwhile, Chile slows and Uruguay shows stable growth.
Looking ahead, we believe economic growth will be supported by the lagged effects of lower interest rates, tamed inflation, trade competitiveness, and easing uncertainty, which may help confidence. In the payments sector, a strong local currency against the U.S. dollar may create an opportunity for businesses to invest in imported capital, upgrade systems, and adopt new technologies. Conversely, foreign card transactions may decline. Certain LAC currency pairs could favor cross-border transactions. Lower interest rates may reduce the cost of expansion and, along with low inflation, support transaction volumes. However, low rates can compress margins on revolving credit, while they help reduce the risk of card delinquencies.
Brazil’s economy resumes gradual cooling
The economy is gradually decelerating, led by weaker investment and government spending along with high interest rates. Consumption slows amid slower job creation, high financing costs, and low confidence, but inflation trends may support future lower interest rates. Brazil’s economy is in the midst of a multi-year slowdown with real GDP growth expected at 2.2 percent this year and 1.8 percent next year. The slowdown follows tighter monetary policy (with lagged effect), limited government spending, and ongoing global uncertainty. This environment is likely to encourage caution among both consumers and producers. Although interest rates are expected to decline next year, the support from lower interest rates will likely become tangible only in late 2026 through 2027.
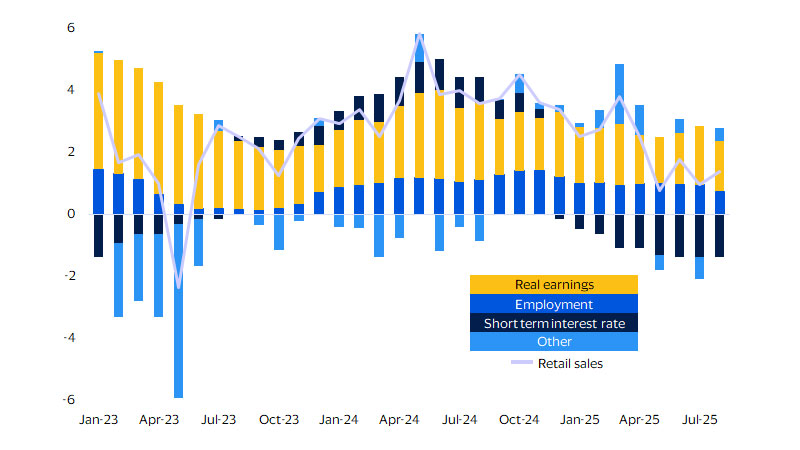
As anticipated, Brazil’s economy began to slow in Q2-2025, following the fading impact of strong harvests earlier in the year. Weaker private investment and reduced government spending added to the slowdown, while household consumption and exports have shown more resilience. Early Q3 data suggest that the slowdown is continuing. Still, economic activity grew 3.1 percent from the start of the year through August, comparable to the 3.0 percent during the same period last year but occurring within a context of moderation. Since peaking in April, annual retail sales growth has decelerated, growing 1.4 percent year-over-year (through August), down from 3.6 percent in 2024. August data on imports of consumer goods also suggest continued moderation in spending, as consumers failed to capitalize on a 16 percent appreciation of the Brazilian real against the U.S. dollar over the first nine months of 2025. One of the largest contributors to retail sales (see figure below), job creation, has slowed since early this year. Workers without formal labor protections such as contracts, social security, or benefits, have been more affected than those with formal contracts, highlighting their vulnerability to economic shifts. Meanwhile, gains in purchasing power have contributed less than last year, mainly due to a rebound in inflation. Persistently high interest rates present an additional headwind.
Businesses are also feeling the pressure, with a sharp drop in business confidence since spring. This likely reflects concerns over the U.S. decision to impose a 50 percent tariff on key Brazilian exports, announced in July and implemented in August. We expect this level to significantly decrease in the coming weeks, as negotiations between the U.S. and Brazil are already in progress. On a more positive note, inflation—as measured by the Extended National Consumer Price Index (IPCA)—has continued to ease. Combined with falling producer prices and subdued economic activity, inflation could dip below 5 percent and approach 4 percent in the coming quarters. This may help support purchasing power and pave the way for lower interest rates.
Retail sales determinants
Annual change and contribution to change, percent; last actual: August 2025
Mexico stagnates amid external and local pressures
Mexico faces a mix of external challenges and internal weaknesses. While short-term prospects remain subdued, especially in consumer spending, monetary easing and trade dynamics could lay the groundwork for a gradual recovery. Mexico’s economy remains weak and nearly stagnant, shaped by its close ties to U.S. trade and immigration policies. These external pressures have combined with a prolonged decline in domestic demand—particularly in private consumption and investment—to weigh down growth for more than two years. Mexico should grow 0.5 percent in 2025, followed by a slight acceleration to 1.3 percent in 2026. The forecast is in line with the weak growth impulse this year. From January to August 2025, economic activity grew just 0.3 percent compared to 1.7 percent during the same period last year. Still, stronger-than-expected performance in services and agriculture helped ease fears of a recession.
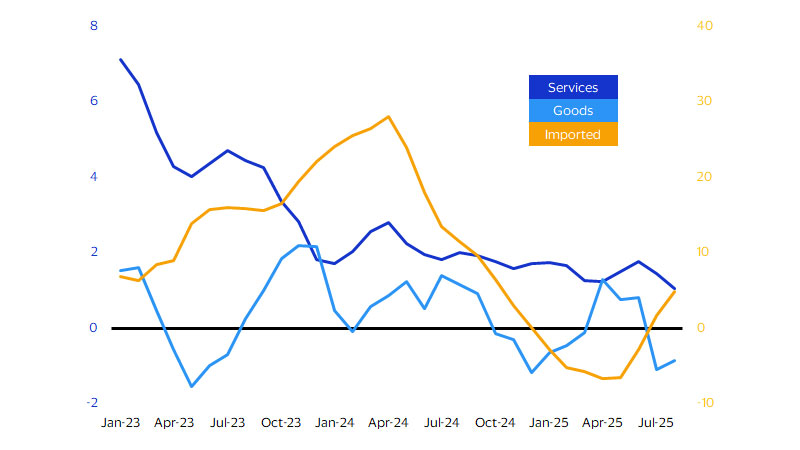
Annual change in consumer spending (see figure below) has been flat since fall 2023. Data through July 2025 shows no clear recovery, except for a modest rebound in non-oil consumer goods imports (June-July), likely supported by a stronger peso. Meanwhile, service spending has stayed stronger than goods, which have already contracted. Retail sales offer a slightly more positive view, with some improvement in August. Labor markets, however, have weakened.* After months of marginal job gains, employment contracted in August. Yet the unemployment rate has held steady at around 2.6 percent, as more people enter the labor force, masking the drop in employment. Meanwhile, remittances fell 10 percent year-over-year in August when measured in pesos. This decline reflects slower job growth for Mexicans in the U.S. and an 8 percent appreciation of the peso so far this year, which reduces the local value of dollar transfers. Similarly, inbound tourism spending declined by 8 percent in pesos from January to July, despite an increase in the number of visitors. Despite ongoing global trade uncertainty and the upcoming USMCA renegotiation in 2026, there are signs of a possible recovery in 2026. Two factors may support this turnaround. First, the central bank has cut interest rates by nearly 4 percentage points since early 2023. These cuts could begin to stimulate credit and investment next year. Second, Mexico’s export competitiveness may improve if tariffs on Asian competitors make Mexican goods more attractive in the U.S. Thus, GDP growth is expected to recover to over 1 percent from 0.5 percent last year.
Private consumption
Annual change, percent, 3-month mov. avg.; last actual: August 2025
Southern Cone: Resilient overall, but for varying reasons
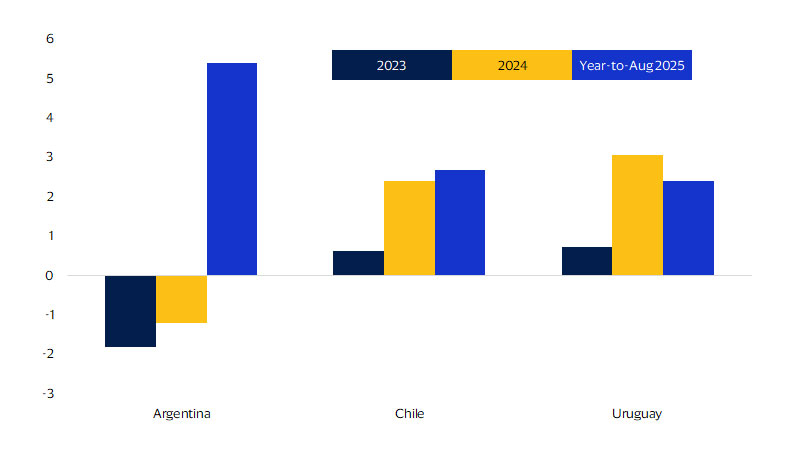
The region continues to expand despite global trade uncertainty. Argentina still leads the region, although its recovery has started to lose momentum, as Uruguay grows on strong domestic demand while Chile is poised to benefit from lower interest rates. Chile and Uruguay should see economic growth above 2 percent this year and next as price stability, fading global uncertainty, and the lagged effects of easing interest rates start to take hold. Recovery in Argentina remains highly conditioned to reforms and economic programs. As expected, the subregion has remained relatively resilient to high global trade uncertainty and the effects of tariffs—printing year-to-August economic growth at or above 2.4 percent. Argentina may be the most vulnerable, but this is mainly due to internal developments and the evolution of its stabilization programs. Meanwhile, Chile is well positioned to benefit from the delayed effects of recent central bank interest rate cuts and Uruguay still exhibits a domestic demand in good shape.
Argentina extended its economic recovery through Q2 and Q3, though at a slower pace, supported by its stabilization program and advantageous annual comparison. The country posted cumulative growth of 5.4 percent from January to August, in contrast to the 3.0 percent contraction during the same period last year. Also, inflation has continued to trend downward, reaching 32 percent in September after peaking at 285 percent in April 2024. Sharp drops in supermarket and shopping center sales over the summer suggest that consumers are becoming more cautious, cutting back not only on discretionary spending but also on everyday purchases (explained by smaller gains in real wages, declining employment, and low consumer confidence). Implementing reforms and achieving sustainable economic growth remain the main challenges ahead.
The Chilean economy has also experienced a gradual slowdown since late spring, with annual growth rates falling from 4 percent in May to just above 2 percent in September. The main contributors to this slowdown have been the mining sector, along with ongoing fiscal consolidation. However, the continued easing of inflation and the delayed effects of lower interest rates may help support economic growth through increased private consumption and investment in the coming quarters. Consumer confidence is now above its four-year average, driven by current economic conditions and optimism about the future. This may imply a more constructive environment for household spending.
In Uruguay, the economy has shown stable annual growth of around 2.7 percent, with private consumption outperforming public spending, overall investment, and exports. This is due to a resilient labor market and further gains in purchasing power, supported by a sustained decline in inflation. Unlike other countries in the region, Uruguay’s strong domestic demand and other factors may prevent inflation from falling below 4 percent in the coming months. This could limit the room and pace for further central bank interest rate cuts.
Real GDP
Annual change, percent; last actual: August 2025
Andean: Balancing recovery and external risks
Economic growth in Colombia, Peru, and Ecuador is supported by low inflation and interest rates, but faces mixed global commodity trends, fiscal consolidation pressures, and external vulnerabilities tied to major trade partners. The region remains highly dependent on global demand, particularly from the U.S. and China, which influences local economies through commodity prices. While global demand is not expected to rebound sharply in the coming quarters, low interest rates and low inflation, which support real wages, may continue to facilitate growth. The international price of precious metals appears to serve as a hedge against uncertainty. Regional performance has been mixed during the first three quarters of 2025. International prices for industrial and precious metals have shown signs of recovery, while grains and oil have declined. On the fiscal side, expansionary public spending is unlikely to be implemented, as most countries in the region are undergoing varying degrees of fiscal consolidation. In contrast, one of the region’s key advantages is its relatively low inflation and interest rates, which continue to support consumption.
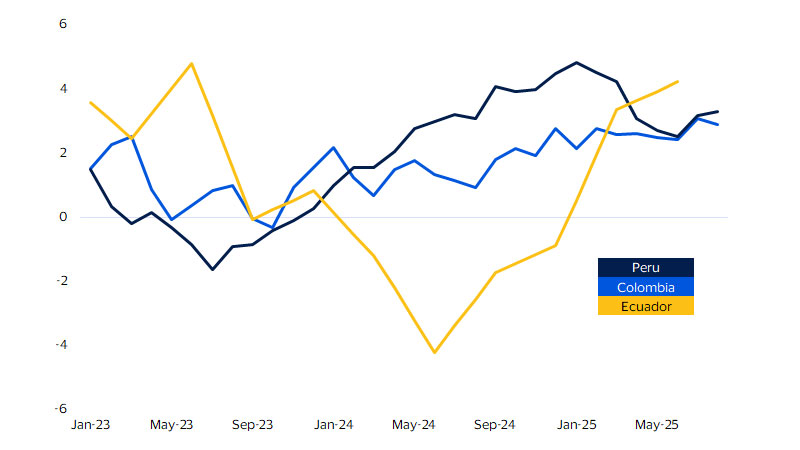
Colombia’s economy has gained momentum in 2025, with economic activity expanding by 2.6 percent year-to-August, up from 1.3 percent during the same period last year. Such momentum has been mainly driven by the service sector, a labor-intensive activity, in contrast to the weaker farming and industrial sectors. On the spending side, private consumption has noticeably improved, partially offsetting weaker investment. Consumer spending has been supported by lower interest rates, rising real wages, and stable inflation. Still, slower job creation and slightly higher unemployment may limit the pace of spending growth.
Peru recorded economic growth of 3.3 percent year-to-July, compared to 2.9 percent during the same period last year. Despite this, the economy has shown signs of gradual deceleration, particularly in the commerce sector, likely reflecting slower job creation. This trend persists despite falling inflation, lower inflation expectations, and rising real wages. On the external front, Peru continues to benefit from strong mining exports but remains vulnerable to fluctuations in global commodity prices and demand, especially from China. Looking forward, the delayed effects of lower interest rates may continue to support consumption and overall activity.
In Ecuador, low inflation and a slight rise in consumer confidence have driven improvements in employment and purchasing power. This suggests the recovery in private consumption observed in Q1 (the latest available data) may have extended into Q2 and Q3. However, risks remain, particularly due to ongoing fiscal consolidation and significant external vulnerabilities tied to oil exports. The economic performance of the U.S., China, and the EU is also crucial for Ecuador, given their roles as major importers.
Economic activity
Annual change, percent, 3-month mov. avg.; last actual: August 2025
Central America and the Caribbean show mixed signals
The region shows varied growth speeds amid U.S. policy shifts and recent global and local developments, with Costa Rica and Guatemala outperforming while Panama and the Dominican Republic slow down. Central America and the Caribbean may show uneven economic growth through the rest of 2025 and into 2026, amid a challenging global environment characterized by weaker demand from the U.S. and China and persistent global trade tensions. Remittances and tourism may provide some resilience, but the region remains vulnerable to external shocks and climate risks. The region remains among the most vulnerable to shifts in U.S. trade and immigration policy, due to its reliance on global trade and remittances. Inbound tourism also represents a key channel through which global uncertainty, a weaker U.S. dollar, and immigration procedures at ports of entry can affect the region.
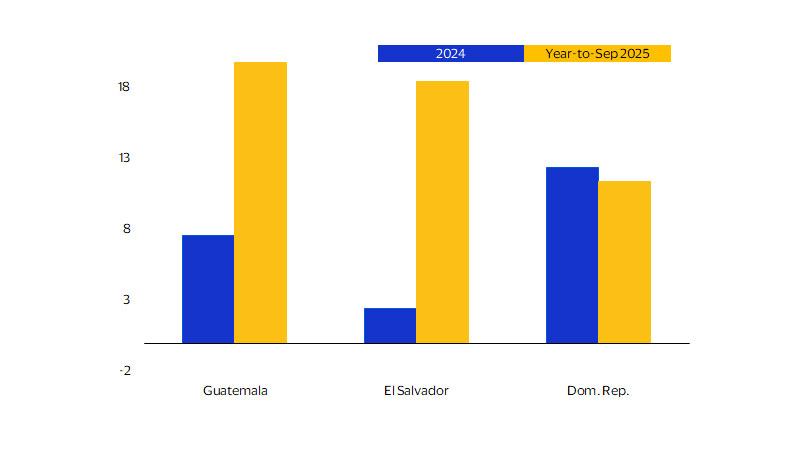
Costa Rica and Guatemala posted solid growth in Q2 and Q3, while Panama and the Dominican Republic experienced a steady slowdown. As of August, Costa Rica and Guatemala reported cumulative growth of around 5 percent and 4 percent, respectively. Costa Rica’s strength is linked to its innovative, high-value-added manufacturing sector, while Guatemala’s growth appears driven by construction and commerce. Low inflation has boosted purchasing power and, in turn, supported household consumption. However, job creation remains a key factor to watch—Costa Rica has already reported slower employment gains. Remittances have also contributed positively: Costa Rica and Guatemala saw year-to-September increases of 7.5 percent and 20 percent in local currency, respectively, despite currency appreciation against the U.S. dollar. In contrast, Panama and the Dominican Republic (more exposed to global trade and tourism) have seen a gradual cooling in activity. Still, Panama recorded a strong 4.6 percent growth from January to September, up from 2.1 percent in the same period last year, partly due to a modest rebound in Panama Canal traffic and revenues in Q3. The Dominican Republic, however, saw a sharper slowdown, with growth falling to 2.3 percent from 5.2 percent last year. Early-year data showed Panama’s household consumption growing 3.3 percent annually in Q1, but consumer goods imports suggest a dip in Q2 followed by a recovery in Q3, helped by ongoing deflation. Meanwhile, consumer spending in the Dominican Republic started weak, with just 0.9 percent quarterly growth in Q1, down from 2 percent in Q4-2024. A 15 percent year-to-August increase in remittances and a 2 percent rise in tourist arrivals may have helped offset a slight uptick in inflation (from 4 percent to 4.3 percent by September), supporting consumption.
Remittances
Local currency, annual change; last actual: September 2025
Forward-Looking Statements
This report may contain forward-looking statements within the meaning of the U.S. Private Securities Litigation Reform Act of 1995. These statements are generally identified by words such as “outlook”, “forecast”, “projected”, “could”, “expects”, “will” and other similar expressions. Examples of such forward-looking statements include, but are not limited to, statements we make about Visa’s business, economic outlooks, population expansion and analyses. All statements other than statements of historical fact could be forward-looking statements, which speak only as of the date they are made, are not guarantees of future performance and are subject to certain risks, uncertainties and other factors, many of which are beyond our control and are difficult to predict. We describe risks and uncertainties that could cause actual results to differ materially from those expressed in, or implied by, any of these forward-looking statements in our filings with the SEC. Except as required by law, we do not intend to update or revise any forward-looking statements as a result of new information, future events or otherwise.
Disclaimers
The views, opinions, and/or estimates, as the case may be (“views”), expressed herein are those of the Visa Business and Economic Insights team and do not necessarily reflect those of Visa executive management or other Visa employees and affiliates. This presentation and content, including estimated economic forecasts, statistics, and indexes are intended for informational purposes only and should not be relied upon for operational, marketing, legal, technical, tax, financial or other advice and do not in any way reflect actual or forecasted Visa operational or financial performance. Visa neither makes any warranty or representation as to the completeness or accuracy of the views contained herein, nor assumes any liability or responsibility that may result from reliance on such views. These views are often based on current market conditions and are subject to change without notice.
Visa’s team of economists provide business and economic insights with up-to-date analysis on the latest trends in consumer spending and payments. Sign up today to receive their regular updates automatically via email.