Economic outlook and forecasts India’s festive cheer gets a tax boost

November 2025 – Festivals in India are more than just shopping, exchanging gifts and indulging in sweets and other delicacies. They play a pivotal role in driving domestic consumption, accounting for about 40 percent¹ of annual sales for businesses and supporting the broader economy.
However, India’s consumer economy has faced mounting headwinds of late in the form of high inflation and weak wage growth, with Visa’s India Spending Momentum Index (SMI) also remaining mostly below 100 for the last two years. The recent trade tensions with the U.S.—its biggest export market—and the imposition of 50 percent tariffs in August made things worse. In order to prop up consumer spending, the Indian government slashed the goods and services tax (GST) rate in September. The new system, which took effect on September 22, reduced both the size of the tax and its complexity.
This was intended to provide a fiscal boost and followed income tax cuts earlier in the year and a much-needed slowdown in retail inflation, sparking hopes of strong festive spending. Leveraging anonymized VisaNet transaction data and Visa’s Spending Momentum Index, our analysis suggests the measures had the desired effect—helping to lift spending during the 2025 Hindu festive season (from September to October this year) and likely giving retailers a welcome boost as well.
Tax cuts added to the festive fervor in 2025
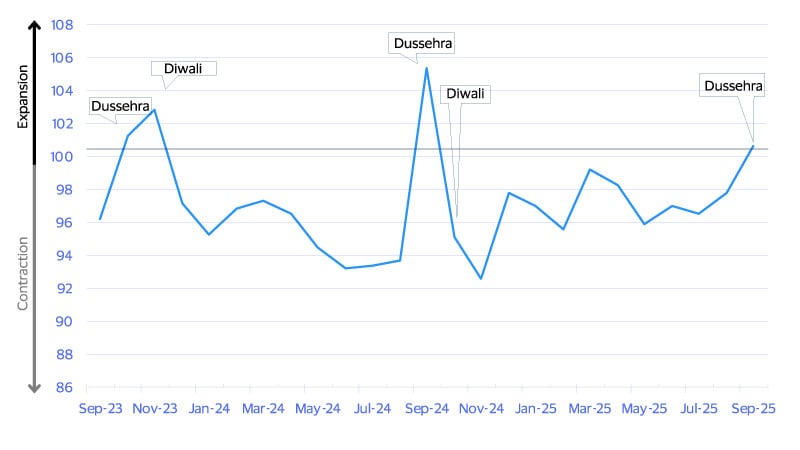
Over the past two years, India’s SMI exceeded 100 only during the festive season
Visa spending momentum index tracks whether change in household spending was above, below or at the same level as the year-earlier period. Not seasonally adjusted; *≥100 = expansion, <100 = contraction
Retailers across sectors—from garments to gadgets—prepare for brisk sales during this period. While stores and shopping malls anticipate increased footfall, online retailers offer attractive discounts and logistics players prepare to deliver orders on time. In previous years, online retail platforms have reported eight times more sales during this period than an average day.²
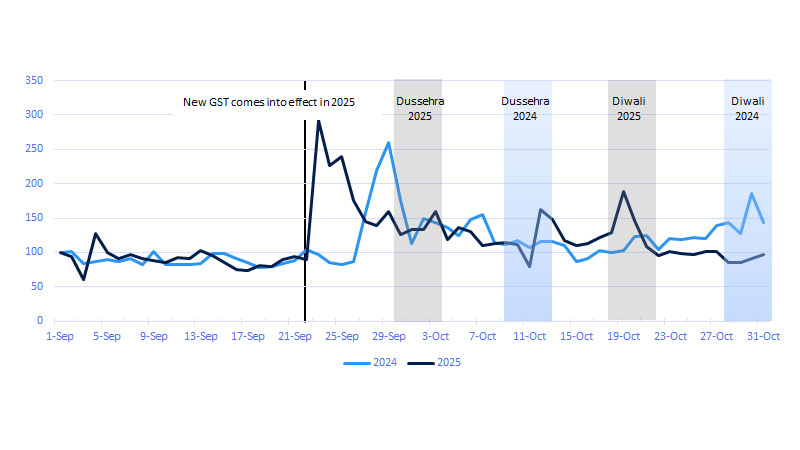
Our analysis of spending by Visa cardholders confirms that the tax cuts, which came just in time for the start of the festive season, was helpful in driving spending (see figure below). We compared aggregated spending across key consumer categories* in September and October 2024 and the same period in 2025 to see how spending fared in both years relative to their respective baseline (of September 1). In both cases, spending surged around the key festival dates for Dussehra and Diwali, but we noted a key difference between the two years. Spending peaked in 2024 about two weeks before Dussehra, while in 2025 the peak came later—about nine days before Dussehra, suggesting consumers waited for the tax cuts to start shopping. The tax cuts likely also helped release pent-up demand, as spending peaked in 2025 at nearly three times the baseline. On a comparative basis, the surge in 2024 was lower.
Tax relief bodes well for festive spending in 2025
Spending on Visa cards in India in Indian rupees on select categories,* Sep 1=100
Shopping surged across online carts and store aisles
Our analysis also accounted for Indian consumers’ preference for online shopping and how this played out during the festive shopping season. A young, tech-savvy and aspirational consumer base makes India the third-largest online retail market in the world. Our analysis showed that peak spending coincided with the biggest shopping festivals launched by e-commerce platforms. Notably, in 2025, although the GST cuts came into effect on September 22, the spike in spending occurred on September 23, when the online shopping discounts kicked in (see figure above).
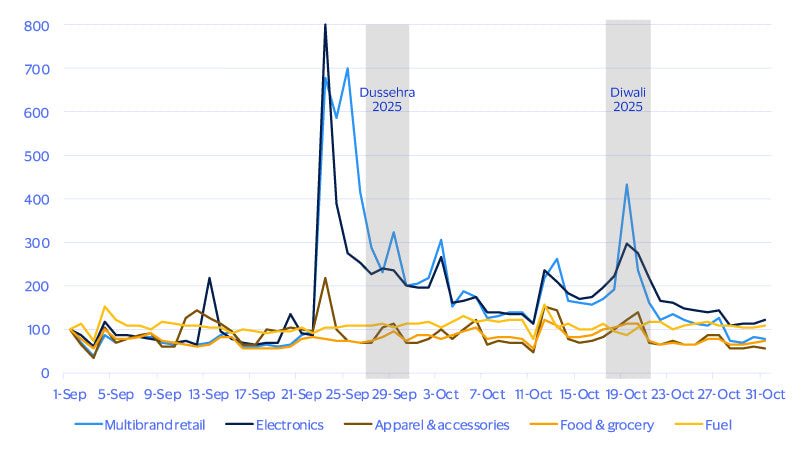
However, festival shopping was not just limited to online retail. Multi-brand retail formats—including department stores, discount outlets, as well as omnichannel and pureplay online retailers—saw one of the biggest spending surges among all the categories that we analyzed (see figure below). These formats offer a breadth of choice and price comparison abilities, making them convenient for the festive season when consumers are often looking to do all their shopping in one go.
A tale of apparel, electronics and more
Spending on Visa cards in India in Indian rupees in 2025, Indexed Sept. 1=100
Big-ticket buys steal the spotlight
The fiscal revamp led to the removal of taxes on food staples, such as milk and chapati, and slashed rates for a range of fast-moving consumer goods, household items, consumer electronics, appliances, apparel and automobiles. The impact of the tax cuts, however, was not equal in all categories of goods, and depended in part on the nature of the product.
Demand for food and essential items tend to be inelastic, so the lower prices in these categories wouldn’t necessarily translate into higher sales. This shows up in the figure above, where spending on food and groceries remained flat or lower against the baseline. However, lower spending on food and staples likely helped free up disposable income, especially for the country’s vast majority of middle-income consumers, thereby giving discretionary spending a bump in other categories such as electronics.
Seasonal preferences have also played a role: around Dussehra and Diwali, consumers splurge on new clothes and make big-ticket purchases like appliances. According to our analysis, spending on apparel by Visa cardholders more than doubled from the baseline on September 23, while electronics purchases jumped nearly eightfold, making it the best-performing category. The latter also stands out as the category where spending remained above the baseline through October, even after this year’s festivities and shopping offers were wrapped up.
The fiscal incentives, along with lower retail inflation (which fell to an eight-year low in September),³ helped marginally boost consumer confidence.⁴ Visa’s analysis of shopping trends can be useful for merchants in understanding how demand for different products varies across months and days, even during peak shopping seasons. Knowing what and when consumers are looking to buy will be key to sustaining this spending momentum beyond the festive season. Multi-brand retailers can double down on timely marketing and shopping offers, while merchants in high-performing categories, such as electronics, might focus on strengthening sales channels and exploring collaborations with multi-brand and omnichannel retailers.
Methodology
The Visa Spending Momentum Index (SMI) measures the breadth of year-over-year change in household spending within an economy, including the share of households with increased spending compared with those where spending was stable or declined. The index is generated using proprietary techniques that extract economic signals from business-related noise inherent in VisaNet transaction data, such as portfolio flips, routing changes, or evolving acceptance across geographies or merchant segments. Regional and national aggregates are population-weighted averages.
The resulting sample data is then aggregated using a diffusion index framework in which index values are scored from 0 to 200. Values above 100 indicate broad-based net acceleration in economic momentum. Values below 100 indicate contraction on an annual basis. To ensure compliance with Visa’s confidentiality obligations and with applicable laws, any market or competitor data that does not meet Visa Inc.’s minimum benchmarking requirements will not be shared.
Disclaimer
The Visa Spending Momentum Index (SMI) is based on a sample of aggregated, depersonalized VisaNet and third-party data; it is not reflective of Visa operational and/or financial performance. SMI is provided “as is” without warranties of any kind, express or implied, including, without limitation, as to the accuracy of the data or the implied warranties of merchantability, fitness for a particular purpose, and/or non-infringement.
SMI is intended for informational purposes only and should not be relied upon for marketing, legal, technical, tax, financial, or other advice. Visa is not responsible for your use of the information contained herein, including errors of any kind, or any assumptions or conclusions you might draw from its use, and Visa has no obligation to update data contained therein.
The views, opinions, and/or estimates, as the case may be (“views”), expressed herein are those of the Visa Business and Economic Insights team and do not necessarily reflect those of Visa executive management or other Visa employees and affiliates. This presentation and content, including estimated economic forecasts, statistics, and indexes are intended for informational purposes only and should not be relied upon for operational, marketing, legal, technical, tax, financial or other advice and do not in any way reflect actual or forecasted Visa operational or financial performance. Visa neither makes any warranty or representation as to the completeness or accuracy of the views contained herein, nor assumes any liability or responsibility that may result from reliance on such views. These views are often based on current market conditions and are subject to change without notice.
Footnotes
- Business Standard. (2025, October 18). GST cuts boost spending; festive, wedding season sales to cross ₹7 trn.
- Fortune India. (2024, October 15). Flipkart leads as e-commerce firms clock ₹40,000 crore during festive sale.
- Government of India, Ministry of Finance. (2025, September). Monthly Economic Report: September 2025. Department of Economic Affairs.
- Reserve Bank of India. (2025, October 1). Inflation Expectations Survey of Households – September 2025.
Visa’s team of economists provide business and economic insights with up-to-date analysis on the latest trends in consumer spending and payments. Sign up today to receive their regular updates automatically via email.