Travel and cross border Higher fuel costs set to reroute travel across Asia Pacific
April 2026 – Travel is one of the most important spending categories in Asia Pacific (AP), being the third-largest and fastest-growing merchant segment in 2025. Broadly defined, travel spending last year by Visa cards issued in Asia Pacific totaled nearly $180 billion USD.¹ Of that amount, $17 billion USD was spent on AP-issued cards at merchants in Europe, the Middle East and Africa (EMEA).
With higher fuel costs and airspace disruptions, these flows will look quite different in 2026, and governments, financial institutions and merchants face significant opportunities and risks. To meet the rising challenges, travel industry providers may need to take quick action, including:
- Rebalancing networks and partnership strategies around growing hubs
- Pivoting demand-generation to trips that could substitute for disrupted or more expensive trips, targeting the preferences of the affected customer archetypes
- Competing on flexibility and reassurance, and strengthening propositions for comparison shopping and risk mitigation
- Preparing for sustained higher travel costs and capacity constraints, while optimizing for resilient segments such as business and premium
- Capturing more local and shorter-haul spend to substitute for any reduced inbound volumes
- Adjusting payments, foreign exchange and risk parameters to ensure seamless transactions
Diverted flows
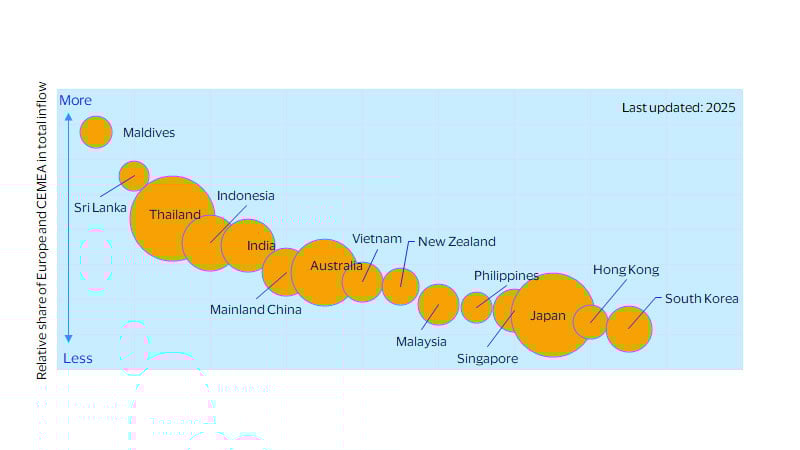
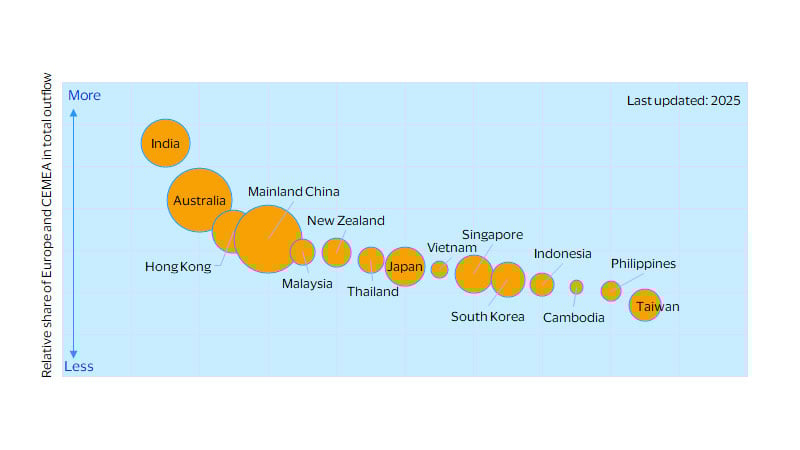
Many AP travelers will likely shift their plans away from EMEA this year due to reduced flight capacity and higher ticket prices. The largest amount of spending looking for a new home will come from India, Australia, Mainland China and Hong Kong. In each of these four markets, more than 30 percent of total outbound in-person spend was through merchants in EMEA in 2025, making this a key opportunity for AP businesses. At the same time, tourism-dependent merchants in markets like the Maldives and Sri Lanka, where more than 50 percent of tourist spend in 2025 came from cards issued in EMEA, will need to find new customers. Same for Thailand, Indonesia and India, where that share was more than 30 percent.
EMEA-dependent tourism markets are more exposed to travel disruptions
Bubble size represents value of inflows from Europe and CEMEA, USD billions
Some AP travelers to EMEA destinations may look for alternatives in 2026
Bubble size represents value of outflows to Europe and CEMEA, USD billions
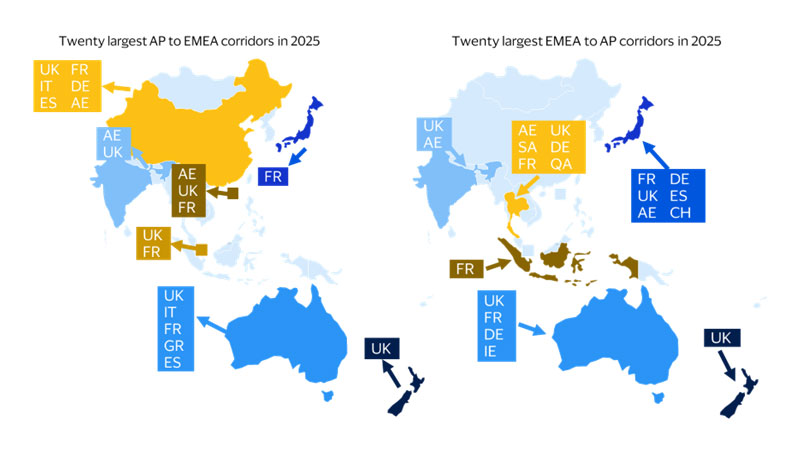
Which large payment corridors will be the most impacted?
Corridors based on VisaNet cross-border spend data (in USD)
Space in the skies
Middle Eastern airlines carried one-quarter to one-half of passengers between Asia Pacific and Europe in 2025, depending on the market.² With much of that capacity removed, and safety concerns rising, the number of alternative airline hubs is growing. In Australia, searches for airlines such as Cathay Pacific or Singapore Airlines are up by more than 50 percent as flyers look for alternative hubs to get to Europe.³ Airlines that are still flying over Russian airspace, such as those from India and Mainland China, already benefitting from shorter flights and lower fuel costs, are likely to gain market share. North American voyagers can look to Tokyo, Seoul and Taipei as hubs to get to India or Southeast Asia. Our research suggests that buying intention is shifting towards comparison shopping, insurance and flexible ticketing.
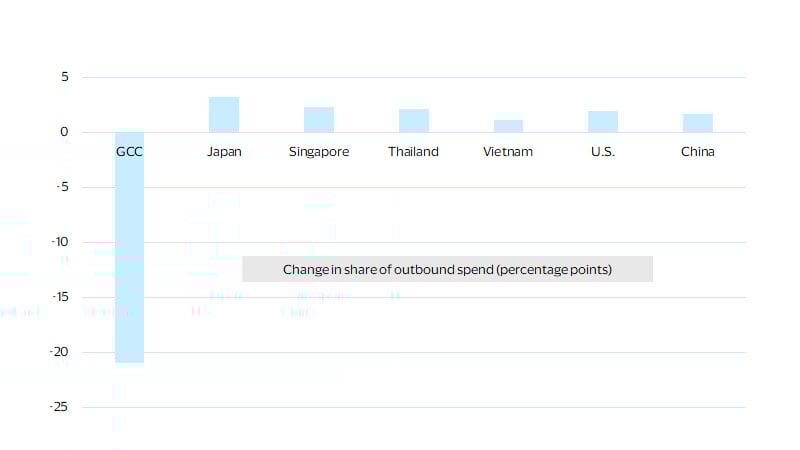
Visa’s data already reflects this redistribution of spend. The share of the six Gulf Cooperation Council (GCC) economies in Indian outbound spend fell by 21 percentage points in March 2026 relative to January-February combined, as airspace closures and risk aversion increased. Around half of this spend was redistributed to Japan, Singapore, Thailand, China (including Hong Kong) and Vietnam. There was also a strong diversion of spend into North America.
Share of outbound spending by Indian cardholders
Percentage point change, March 2026 vs. January-February 2026 combined
Sky-high before you fly
Ticket prices are expected to go up across the board; more expensive jet fuel will raise prices even on routes that do not face any direct disruption. Based on estimates from the International Air Transport Association (IATA) and academic literature, a sustained doubling in jet fuel prices is likely to increase long-term airfares by around 30 percent and reduce demand by 18 percent, although the effect will likely be less in the short term due to airlines hedging fuel costs using contracts that delay cost pass-through.⁴
This effect will not be even: Fare increases are likely to be higher for certain segments facing reduced capacity or higher demand, such as Adelaide to Singapore or Delhi to London. While short-haul travel is generally held to be more sensitive to fare increases than long-haul, this is not as true in AP as it is in Europe or North America. More limited possibilities to switch journeys to cars or trains mean there are fewer substitutes for even short flights. Hence, we would expect to see a diversion of AP-originated leisure travel from long-haul to short-haul. Business travel and travel in premium classes will be more resilient: the benefits of business trips tend to be many multiples of the price of the flight, fuel cost is a smaller share of the ticket price for premium cabins, and airfares are a smaller share of disposable income for affluent consumers. The share of trips accounted for by family reunions will increase as these are likewise less sensitive to price. For example, Indian outbound spend to the U.K., where there is a large diaspora community, will be more robust than outbound spend to France, which is more of a leisure destination.
Opportunities and tactics for the travel industry
Expect a redistribution, rather than a reduction, of spending. Airline revenues may even be higher as price increases outweigh fewer trips. With fewer travelers, though, spending in destination would be expected to grow at a slower pace than otherwise. For corridors subject to capacity reduction or price increases, merchants in alternative locations, including at home, have the chance to gain new customers.
Certain segments, such as commercial and consumer premium cards, may see higher spend. Cutbacks on travel amongst other consumer cards will be uneven, as beachgoers spend less but family reunions continue. The weighting of different markets in spend will adjust, and authorization and risk models should be calibrated to this new reality. Some spending that previously occurred in Middle Eastern hubs will now occur in final destinations. The share of different currency pairs in foreign exchange volumes will adjust.
Under most plausible scenarios, fuel prices will remain high into the second half of 2026. Yet, travel has repeatedly proven itself to be a resilient category: Billions of dollars will still be spent, just in different ways and in different locations. Spending will be redistributed between corridors, merchant categories, channel and card type. Issuers, merchants and acquirers should prepare for an altered travel landscape for the rest of 2026, and agility will be key to capture the upside.
Footnotes
- Based on VisaNet data and includes all spend at travel merchants along with in-person spend at any merchant types in markets apart from where the card was issued.
- Cirium Aviation Analytics
- Visa Global Travel Intentions Study 2026
- IATA 2007, IATA Elasticities Report. According to IATA, fuel accounts for around 30 percent of total airline operating costs, and a 10 percent increase in global ticket prices will reduce travel demand by around 6 percent.
Forward-Looking Statements
This report may contain forward-looking statements within the meaning of the U.S. Private Securities Litigation Reform Act of 1995. These statements are generally identified by words such as “outlook”, “forecast”, “projected”, “could”, “expects”, “will” and other similar expressions. Examples of such forward-looking statements include, but are not limited to, statements we make about Visa’s business, economic outlooks, population expansion and analyses. All statements other than statements of historical fact could be forward-looking statements, which speak only as of the date they are made, are not guarantees of future performance and are subject to certain risks, uncertainties and other factors, many of which are beyond our control and are difficult to predict. We describe risks and uncertainties that could cause actual results to differ materially from those expressed in, or implied by, any of these forward-looking statements in our filings with the SEC. Except as required by law, we do not intend to update or revise any forward-looking statements as a result of new information, future events or otherwise.
Disclaimers
The views, opinions, and/or estimates, as the case may be (“views”), expressed herein are those of the Visa Business and Economic Insights team and do not necessarily reflect those of Visa executive management or other Visa employees and affiliates. This presentation and content, including estimated economic forecasts, statistics, and indexes are intended for informational purposes only and should not be relied upon for operational, marketing, legal, technical, tax, financial or other advice and do not in any way reflect actual or forecasted Visa operational or financial performance. Visa neither makes any warranty or representation as to the completeness or accuracy of the views contained herein, nor assumes any liability or responsibility that may result from reliance on such views. These views are often based on current market conditions and are subject to change without notice.
Visa’s team of economists provide business and economic insights with up-to-date analysis on the latest trends in consumer spending and payments. Sign up today to receive their regular updates automatically via email.