Medellin
Growth in single-person households is reshaping global travel
Global Travel Insight

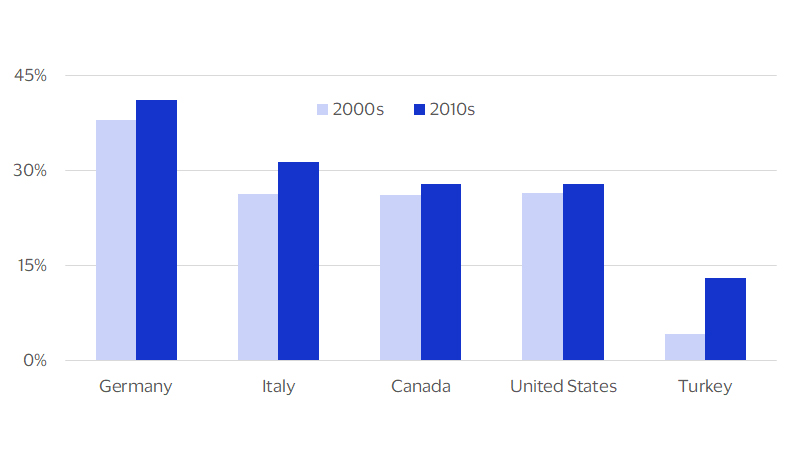
November 2023 – The rise of single-person households is shifting the global consumer landscape, presenting a growing challenge for the travel industry. Single-person households are projected to grow 35 percent this decade to reach 580 million by 2030, accounting for nearly one in four households globally.¹ In leading countries like Germany, single-person households already account for over 40 percent of the total and represent the most common living arrangement. The travel industry will need to adjust to the resulting shift in consumer demand—away from traditional, family-centered vacation travel and towards the less predictable, more eclectic interests of single travelers.
The changing face of traveling consumers offers the potential to accelerate demand for international travel. Cross-border travel rates are higher among consumers in markets with a higher proportion of single-person households in the population. Our analysis of depersonalized and aggregated Visa cardholder data confirms the broad-based appeal of international travel within this demographic, spanning both generations and affluence levels. If current trends hold, the demographic shift should diversify travel well beyond popular tourism destinations over the next decade.
Travel choices of singles differ from established patterns, offering three lessons on tailoring the value proposition for this segment. First, single travelers are more flexible and adventurous in their destination choices, prioritizing value and diversity of their experience over comfort and luxury. Second, while singles may prefer living alone, opportunities to socialize during the trip play a greater role in their choice of travel. Third, single consumers show an aversion to traditional sources for travel planning. Reaching them effectively will depend more on organic marketing.
Single living is growing more prevalent
(Percent share of single-person households in total)
Highlights:
Living alone is increasingly a choice for people of all ages
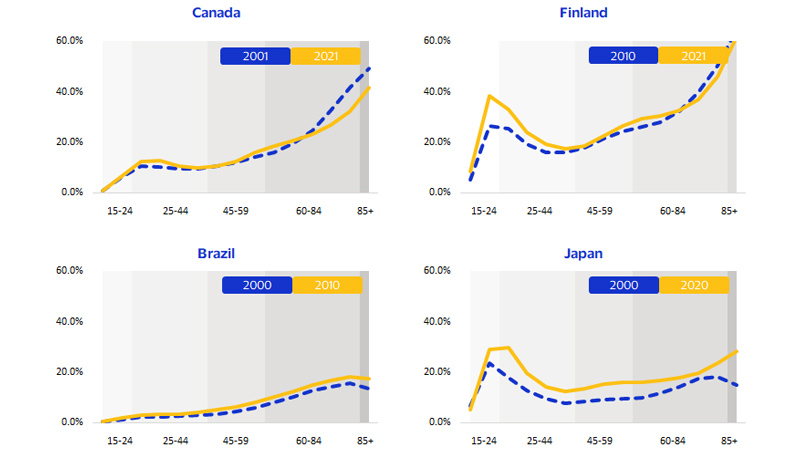
Single consumers represent an important and fast-growing segment for the travel industry, expanding at nearly triple the rate of the overall population growth globally. While population ageing is a contributing factor, the share of single-person households in total has been steadily rising for consumers of all ages in countries as far ranging as Canada, Brazil or Japan. Such a broad-based increase in the prevalence of single-person households spanning multiple regions and cultures reflects increasing comfort with and acceptance of living alone among global consumers, with important ramifications for businesses catering to them.
Single-person households are single-income consumers, and their spending habits reflect that. Single consumers value autonomy and are more conservative with their finances in both their daily lives and their travel preferences.² In a depersonalized and aggregated sample of U.S. consumers, for instance, single credit cardholders were consistently less likely to engage with traditional travel providers,³ underscoring headwinds the industry could face from the continued growth of single consumers over the next decade.
Single-person households are the fastest growing household type across of the world
(Share of single-person households to total households by age)
International travel holds special appeal for global singles
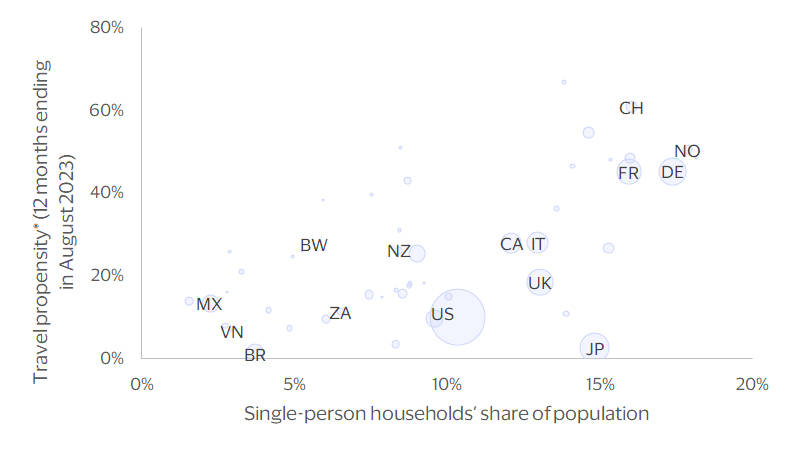
What single consumers may lack in their propensity to travel domestically, they make up in their greater willingness to explore abroad. Populations in markets with a higher share of single-person households show much greater propensity to travel cross-border. Even factoring in the fact that living alone is much more prevalent in more affluent societies, markets with larger numbers of single consumers such as Norway also record higher rates of outbound travel, even when compared to regional peers such as France or Germany.
Across consumers with similar financial means, more of them travel internationally if they are single. In fact, each percentage-point increase in the share of single-person households on average adds about 0.8 percentage points to the propensity of consumers to travel cross-border across countries at similar levels of economic development. What this estimate suggests is that growth of single consumers is likely to compound the lift to global travel demand expected from the expanding middle class in emerging markets over the coming decades.
Societies where single-living is more prevalent show greater propensity to travel abroad
Single consumers’ greater taste for international travel spans generations in U.S. data
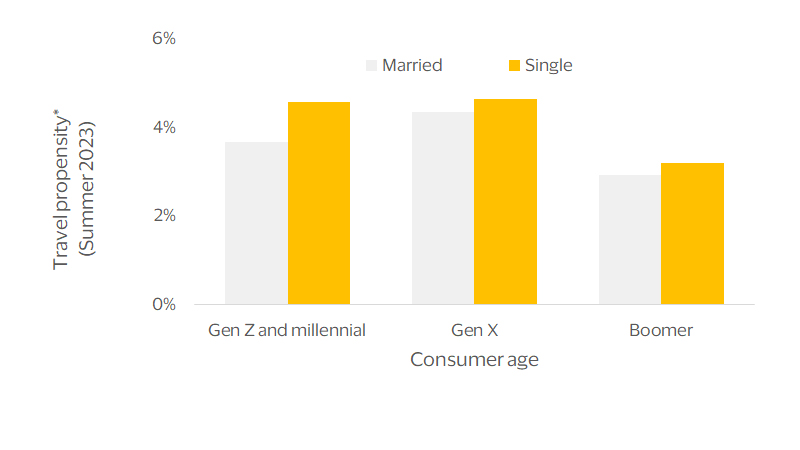
Relative appeal of international travel for single consumers is present across all generations, indicating that cross-country patterns are likely tied to varying prevalence and preference for single living instead of simple differences in the age structure of their respective populations. Depersonalized and aggregated Visa transaction data of U.S. consumer credit cardholders, for example, shows a larger share of single cardholders (compared to married) traveling abroad during the peak summer season in 2023—a pattern that is repeated across all age groups. Correspondingly, single cardholders accounted for a much larger share of U.S. consumer credit cards registering purchase transactions at merchants abroad, relative to population averages. For instance, singles accounted for two out of every three Gen Z and millennial cardholders traveling abroad last summer and just under half of Gen X and older travelers.
Methodology note: Identifying hotspots for single travelers
The rising prevalence of single travelers predicted over the next decade is not likely to change the dominant appeal of the world’s top destinations, but could significantly shift established travel patterns. For cross-border travelers going to France, for example, popular tourist destinations like Paris or Nice consistently dominate the list of cities visited. According to our Visa International Travel platform, more than one in every four travelers visiting the country includes an overnight stay in the greater Paris area.⁴ But where might single travelers go beyond these traditional destinations?
To see how single travelers’ preferences could reshape global tourism flows across different types of destinations, we leveraged depersonalized and aggregated Visa transaction data of U.S. consumer credit cardholders traveling in the summer of 2023. Cities where single travelers account for a much larger share of visitors relative to total arrivals to the country are more likely to experience faster growth over the next decade.
For example, 43 percent of Gen X Americans visiting Montpellier were single—five percentage points higher than the share of singles within Gen X visitors to France overall. Montpellier’s relative popularity among singles is not limited to Gen X travelers, showing similarly outsized shares of singles among visitors of other generations as well.
Such generation-spanning differences in the proportion of singles among U.S. visitors offers a way to gauge the relative popularity of destinations among global single travelers. In the analysis used in this report, destinations are therefore ranked high on this dimension if they satisfied the following three criteria:
- The destination was within the top 50 most visited within region by U.S. credit cardholders in the summer of 2023.
- Share of singles among the visitors to the destination was higher than the average share of singles among all visitors to the region.
- The above-average propensity to visit the destination by singles was broadly present across different age groups and was not driven by any one generation.
Single travelers are more adventurous and flexible in their destination choices
Targeting single travelers may require the travel industry to adapt its offerings to their distinct needs. For example, when planning a vacation, singles tend to be more opportunistic and price sensitive, with key differences in their motivation for travel compared to their married counterparts, according to our analysis of the destination choices of American singles traveling abroad in the summer of 2023:
- Single travelers were more likely to prefer off-the-beaten path destination cities. For instance, married couples show much greater preference for traditional beach destinations such as Los Cabos in Mexico or the Sunshine Coast in Australia while single travelers were relatively more likely to head to cultural destinations such as Merida in Mexico or Melbourne in Australia.
- Urban scenes of Berlin and Milan have greater appeal for single travelers over more traditionally romantic destinations like Venice or Munich.
- Single travelers of all ages show relatively higher predilection for visiting university towns such as Oxford in the U.K. or Montpellier in France over more traditional destinations such as London or Paris
- Single consumers were relatively more likely to explore remote destinations such as the Takasaki mountains in the Oita prefecture or the national park in Lào Cai over traditional tourism hubs such as Tokyo or Hanoi.
- Opportunities for active travel offer more of a draw for single travelers of all ages, who show relatively greater preference for exploring the canyon in Arequipa over more leisurely stay in coastal destinations such as Callao.
Destinations with largest differences in popularity among single versus married travelers⁵
More popular for single travel
Istanbul |
Chon Buri |
Madinah |
|
Santo Domingo |
Berlin |
Chennai |
Dubai |
Tijuana |
Madrid |
Shanghai |
Casablanca |
Rio de Janeiro |
Marseille |
Kuala Lumpur |
Mombasa |
Lima |
Porto |
Jakarta |
Red Sea |
Less popular for single travel
Cozumel |
Munich |
Auckland |
Fes |
Whistler |
Lucerne |
Hiroshima |
Luxor |
Bahamas |
Scottish Highlands |
Sydney |
Riyadh |
Virgin Islands |
Tuscany |
Palawan |
Nairobi |
Cayman Islands |
Kerry County |
Cairns |
Nelspruit |
Serving single travelers will require adaptation
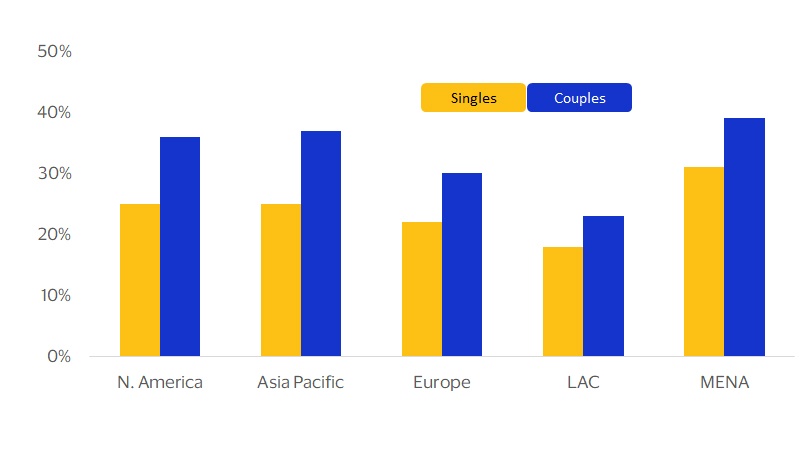
Single consumers look for a different value proposition when planning travel and are more drawn to activities beyond hotels and airports. When it comes to spend on accommodation, Visa data shows that lodging spend per card is lower for single travelers in comparison to couples.⁶ Financial minimalism among single travelers is not a function of income constraints but more of preference. According to a survey of global travel profiles by YouGov, 23 percent of single travelers overall prefer luxury hotels versus 33 percent of couples. This holds true across geographic regions as well as generations and income segments. For instance, even among affluent consumers globally, single travelers express lower preference for staying at luxury hotels when traveling compared to couples.
Serving the single traveler segment will require adjustments to existing travel offerings to meet singles’ need for frequent activity. One option could be restructuring reward programs to include partnerships with a broader set of travel-catering partners such as concert venues or outdoor recreation providers across a wider set of destinations that offer single consumers the opportunity to interact with fellow travelers. Fourteen percent of single travelers from North America, for instance, indicate a preference for group organized travel compared to 10 percent for couples. The gap is even wider for affluent consumers among whom group travel is preferred by 21 percent of singles versus 11 percent for couples.
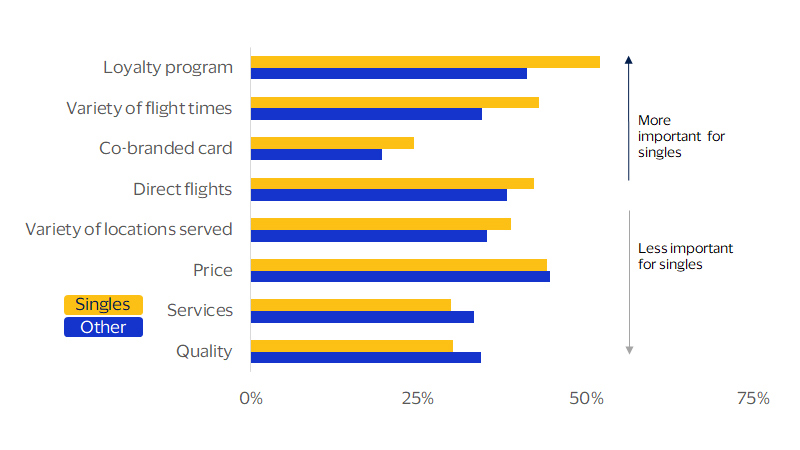
For single travelers key differentiators when purchasing travel are rewards and convenience. According to a survey of U.S. consumers, traditional factors such as price or quality play a secondary role in the choice of a preferred airline, while factors such its loyalty program or availability of direct flights matter relatively more to singles planning an international trip.
Traditional channels such as travel websites or paid media are not effective in reaching global singles, who are more likely to draw inspiration for their next trip from movies, podcasts and other organic content while actively avoiding direct marketing.
Singles are less motivated by luxury
(Respondents who stay at luxury hotels when traveling)
Singles value rewards and convenience more
(Reasons why respondents planning international travel fly with preferred airline most often)
Footnotes
- Visa Business and Economics Insights estimate based on United Nations, Oxford Economics and Euromonitor projections.
- Visa Business and Economics Insights analysis based on YouGov data
- Based on a depersonalized and aggregated sample of U.S. consumer credit cardholders who made purchases at airline, hotel or car rental companies over the summer months of June through August of 2023.
- Based on Visa International Travel platform estimates covering the 2019-2023 period.
- Based on the distribution of lodging transactions made by a depersonalized and aggregated sample of U.S. consumer credit cardholders who traveled abroad during the peak travel months of June through August of 2023. The ranking is based on top 50 destinations within each region.
- Based on lodging transactions made by a depersonalized and aggregated sample of U.S. consumer credit cardholders who traveled abroad during the peak travel months of June through August of 2023.
Forward Looking Statements
This report may contain forward-looking statements within the meaning of the U.S. Private Securities Litigation Reform Art of 1995. These statements are generally identified by words such as “outlook”, “forecast”, “projected”, “could”, “expects”, “will” and other similar expressions. Examples of such forward-looking statements include, but are not limited to, statement we make about Visa’s business, economic outlooks, population expansion and analyses. All statements other than statements of historical fact could be forward-looking statements, which speak only as of the date they are made, are not guarantees of future performance and are subject to certain risks, uncertainties and other factors, many of which are beyond our control and are difficult to predict. We describe risks and uncertainties that could cause actual results to differ materially from those expressed in, or implied by, any of these forward-looking statements in our filings with the SEC. Expect as required by law, we do not intend to update or revise any forward-looking statements as a result of new information, future events or otherwise.
Disclaimer
The views, opinions, and/or estimates, as the case may be (“views”), expressed herein are those of the Visa Business and Economic Insights team and do not necessarily reflect those of Visa executive management or other Visa employees and affiliates. This presentation and content, including estimated economic forecasts, statistics, and indexes are intended for informational purposes only and should not be relied upon for operational, marketing, legal, technical, tax, financial or other advice and do not in any way reflect actual or forecasted Visa operational or financial performance. Visa neither makes any warranty or representation as to the completeness or accuracy of the views contained herein, nor assumes any liability or responsibility that may result from reliance on such views. These views are often based on current market conditions and are subject to change without notice.
Visa’s team of economists provide business and economic insights with up-to-date analysis on the latest trends in consumer spending and payments. Sign up today to receive their regular updates automatically via email.