Growth in a time of populism

January 2025 – In 2025, the Latin America and Caribbean (LAC) economy overall is expected to grow by 1.9 percent, slightly below the previous year. Consumption is expected to moderate in most subregions against a backdrop of smaller gains in real earnings and less resilient labor markets. We anticipate inflation to continue its downward trend toward official targets, supported by central banks' efforts to maintain or set interest rates at levels consistent with that aim. Due to the lag in monetary policy effects, past efforts to lower policy rates will be felt this year, reducing headwinds to economic growth. However, public deficits and debts exceed sustainable levels in many LAC countries, constraining government ability to boost growth through stimulus. Additionally, lower commodity prices and weaker foreign demand lead to a conservative outlook for exports.
Risks include the incoming U.S. administration’s policy positions, which have triggered high levels of uncertainty. Tariffs and tougher immigration policies imposed by the U.S. may adversely affect Mexico and Central America, with minor direct impact on Andean economies and the Southern Cone. Additionally, weather-related shocks and a potential reprise of trade wars could significantly impact the region. However, new trade tensions between the U.S. and China could benefit LAC through nearshoring opportunities.
Real GDP growth forecast for 2025
Annual change, percent
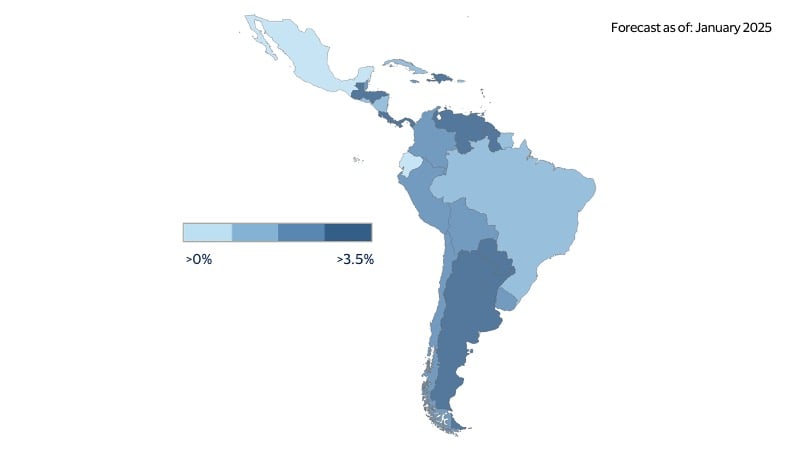
2025: Similar economic growth, different protagonists
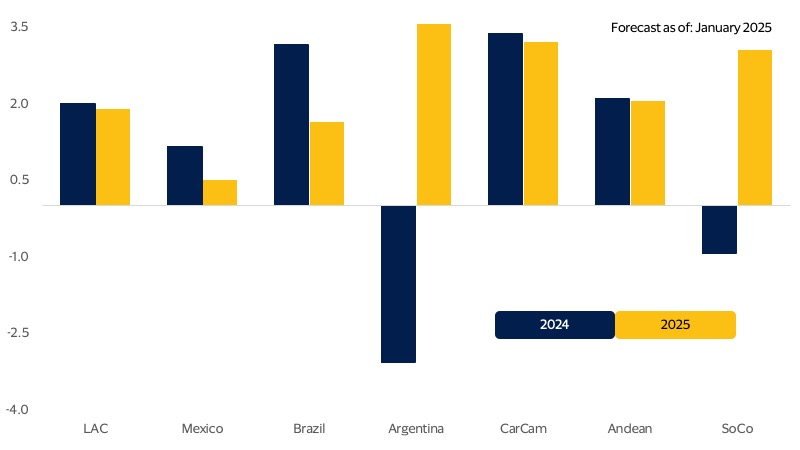
LAC’s economy is expected to grow by 1.9 percent in 2025, with Brazil and Mexico decelerating while Argentina shows growth. The main headwinds include U.S. trade protectionism, fiscal consolidation and investment uncertainty. We anticipate that LAC’s growth this year will decline slightly below the 2.0 percent estimated for 2024. While aggregate GDP growth may be similar, individual contributions will differ, highlighting contrasts within subregions and countries. Brazil and Mexico, which together account for 60 percent of the region’s economy, are set to slow in 2025. Compared to 2024, we expect these regional heavyweights to contribute only half as much to LAC’s economy this year. However, we anticipate that Argentina (with a weight of 9 percent) will partially offset the regional deceleration.
Last year, a combination of high interest rates, stalled U.S. manufacturing, and a deteriorating investment climate drove the deceleration in economic activity. In 2025, different factors will be at play. Less restrictive monetary policy in the form of lower rates will start to act on the economy, along with some recovery in U.S. industry. However, the main headwinds to economic activity could come from trade protectionist measures imposed by the U.S., local fiscal consolidation, and an uncertain investment environment.
Outside the region, developments in the U.S. and China could affect LAC’s economy via weaker demand for exports, lower remittances, and a conservative outlook for new foreign direct investment. Lower commodity prices in key industrial metals, grains, and proteins may complete the picture of moderate headwinds to economic growth.
Within LAC, we expect private consumption to decelerate and government spending to play a marginal role in stimulating economic activity. In contrast, one of the main sources of economic impulse will be the lagged effects of past interest rate reductions by regional central banks.
Moreover, the reprise of a trade-war environment and latent geopolitical tensions may bring back nearshoring hopes, helping to set the stage for a recovery in consumer and producer confidence, along with investment sentiment. The Southern Cone is particularly well-positioned for an economic rebound this year, bolstered by a return to positive GDP growth rates in Argentina and relative economic resilience in Chile.
GDP growth forecasts
Annual change, percent
Fasten your seatbelts: Trump 2.0 is coming
U.S. policy changes such as imposing tariffs on Mexican exports, resuming a trade war with China, and tightening immigration restrictions would adversely impact exports, investments, remittances and financial markets in Mexico and Central America. Consumers in those countries may experience adverse effects on their disposable income, confidence, and purchasing power.
We expect U.S. policy shifts this year to impact the LAC region via three main channels—exports, remittances and immigration. Under such a scenario, Mexico stands to be the most economically exposed. This challenging environment could be fluid and volatile, with trade protectionist measures linked to U.S. demands on trade and non-trade-related issues with tight deadlines. The situation is likely to heat up as we approach the U.S.-Mexico-Canada Agreement (USMCA) review period scheduled for 2026. On the other hand, some U.S. policy proposals, such as tariffs, may trigger offsetting factors through foreign exchange (FX), tourism, and remittances that help cushion the overall economic blow.
Judging by the historical evidence, if the U.S. imposes tariffs on Mexican imports, we can assume that Mexico would retaliate with targeted protectionist measures. However, a relevant offsetting force would come from exchange rate depreciation triggered by risk aversion, creating tailwinds for exports, remittances, and tourism. The eventual effect of new or higher tariffs on Mexican products would depend heavily on the relative size of new measures affecting imports from China. Higher tariffs on China relative to Mexico may even boost demand for imports from the latter. Additionally, if the U.S. extends tax cuts currently set to expire at the end of 2025, this should support continued U.S. consumer spending and thus continue to draw in more imports from Mexico.
In the case of Central America, Guatemala, Honduras, El Salvador and Nicaragua are likely to be the most vulnerable countries in that subregion, given the relevance of inbound remittances from the U.S. Stronger immigration policies, together with a deceleration of Hispanic employment linked to the business cycle, may impose headwinds to money-sending. A strong U.S. dollar and recovered travel sentiment may help the region partially offset the complex scenario via inbound traveling. Last year, Central America outperformed the rest of the subregions in LAC in terms of recovery in tourism. Meanwhile, Brazil, the Andean region, and the Southern Cone may feel indirect effects in the form of lower prices for industrial metals, grains and protein due to weaker demand from China. In contrast, a relatively strong U.S. dollar may overall be favorable for LAC via remittances and tourism, along with competitiveness in exports.
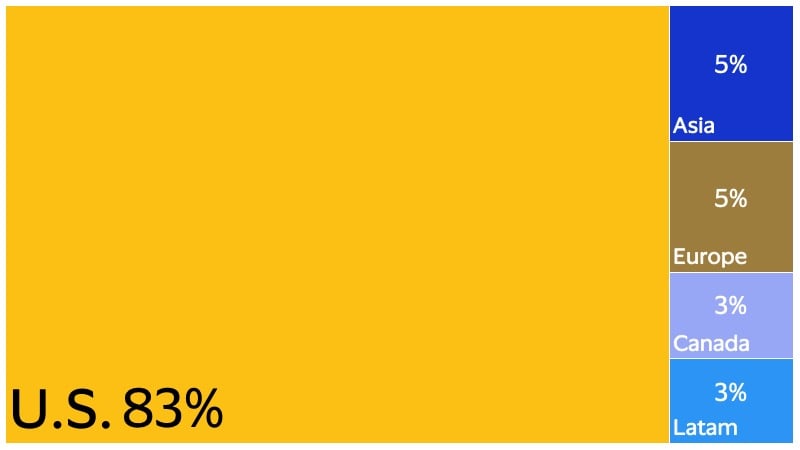
Mexico’s global export destinations
Percent of total Mexican exports
Inflation improves under central banks' surveillance
Headline inflation forecasts
Annual change, percent
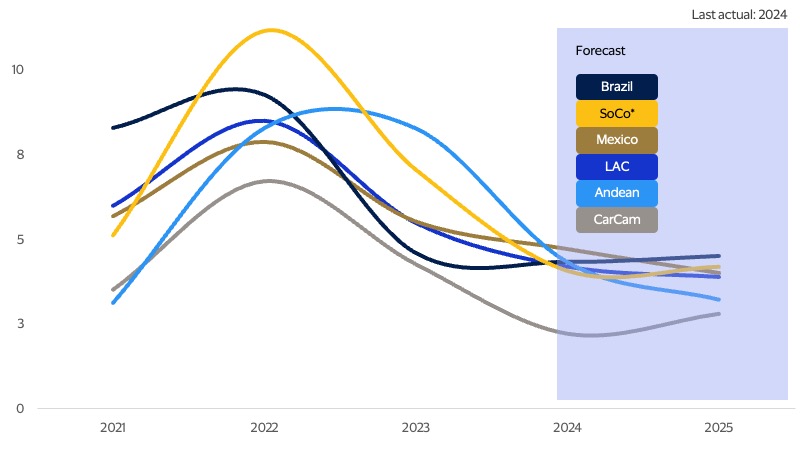
The inflation highs of two years ago have retreated as the initial shocks that generated significant upside pressures on consumer prices have also dissipated. Central banks’ efforts to increase policy interest rates followed, bringing inflation down even further. Merchandise prices proved to be more flexible to the downside, while inflation in services was more reluctant to decrease. Further improvement (if any) was far more modest during 2024, when volatile agricultural and energy prices justified a cautious approach by central banks. The main lesson from last year is that the return to central bank inflation targets is unlikely to be linear.
LAC starts 2025 with central banks showing a cautious approach and divided into two groups. Those that have further policy rate cuts as part of their plan (e.g., Mexico, Colombia, Chile, and Peru) and those that may be forced to further hike the benchmark interest rate to rein in inflation and strengthen credibility (e.g., Brazil). Still, we expect most regional central banks to reach interest rate levels congruent with low inflation.
The described scenario has risks attached. A trade war reprise may translate into higher import prices and exchange rate depreciation, imposing new upside risks to both producer and consumer prices. Historically low pass-through from currency depreciation to inflation may be the best ally to tame inflation. However, the stability of inflation expectations at levels close to the central bank target will be crucial.
Outside of the Southern Cone, consumption will slow
Private consumption in LAC should moderate, with regional variations and challenges.
Moderating private consumption should bring the annual rate down from an estimated 2.1 percent in 2024 to 1.5 percent in 2025. As with overall economic growth, the aggregate is not necessarily representative of specific subregion and country dynamics. Purchasing is expected to decelerate as the resilience of labor markets in Brazil and Mexico wanes and gains in real earnings erode. The effects of higher interest rates in Brazil, due to efforts by its central bank to contain inflation and its expectations, will also play a relevant role.
A similar scenario would imply slower consumer spending in Central America and the Caribbean and the Andean countries. In the Southern Cone, however, consumption is expected to rebound due to recovering consumer spending in Argentina and robust economic momentum in Uruguay.
El Niño, La Niña, and the whole family
Climate shocks in LAC create unpredictable economic risks.
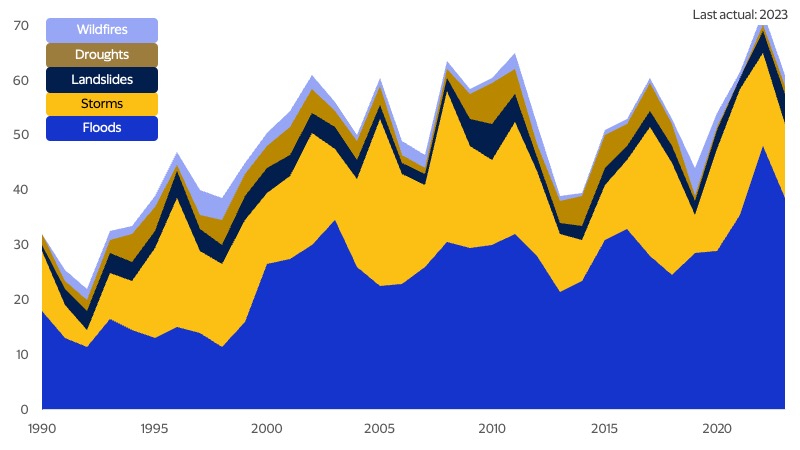
One of the biggest risks to this outlook is the increasing frequency and intensity of climate shocks in LAC. Since the 1990s, the annual number of climate shocks in the region has more than tripled— from a low of 22 in 1992 to a high of 73 in 2022. Not only do these events have the potential to distress large swaths of the population, but they can also impact consumption, infrastructure, logistics, food prices, and, ultimately, migration patterns. This creates a wildcard effect in our economic outlook due to its unpredictability from one year to the next.
Climate shocks in LAC
Number of events
Forward-Looking Statements
This report may contain forward-looking statements within the meaning of the U.S. Private Securities Litigation Reform Act of 1995. These statements are generally identified by words such as “outlook”, “forecast”, “projected”, “could”, “expects”, “will” and other similar expressions. Examples of such forward-looking statements include, but are not limited to, statements we make about Visa’s business, economic outlooks, population expansion and analyses. All statements other than statements of historical fact could be forward-looking statements, which speak only as of the date they are made, are not guarantees of future performance and are subject to certain risks, uncertainties and other factors, many of which are beyond our control and are difficult to predict. We describe risks and uncertainties that could cause actual results to differ materially from those expressed in, or implied by, any of these forward-looking statements in our filings with the SEC. Except as required by law, we do not intend to update or revise any forward-looking statements as a result of new information, future events or otherwise.
Disclaimers
The views, opinions, and/or estimates, as the case may be (“views”), expressed herein are those of the Visa Business and Economic Insights team and do not necessarily reflect those of Visa executive management or other Visa employees and affiliates. This presentation and content, including estimated economic forecasts, statistics, and indexes are intended for informational purposes only and should not be relied upon for operational, marketing, legal, technical, tax, financial or other advice and do not in any way reflect actual or forecasted Visa operational or financial performance. Visa neither makes any warranty or representation as to the completeness or accuracy of the views contained herein, nor assumes any liability or responsibility that may result from reliance on such views. These views are often based on current market conditions and are subject to change without notice.
Visa’s team of economists provide business and economic insights with up-to-date analysis on the latest trends in consumer spending and payments. Sign up today to receive their regular updates automatically via email.