Customer segmentation The great wealth transfer reality check

July 2026 – It’s been called the greatest wealth transfer in history. But how big will it be? Pick a number, any number: $110 trillion? $124 trillion? The answer depends on who is counting and what they are measuring, which creates noise but not necessarily clarity on what matters: how much will be passed down and how will it impact consumer spending.
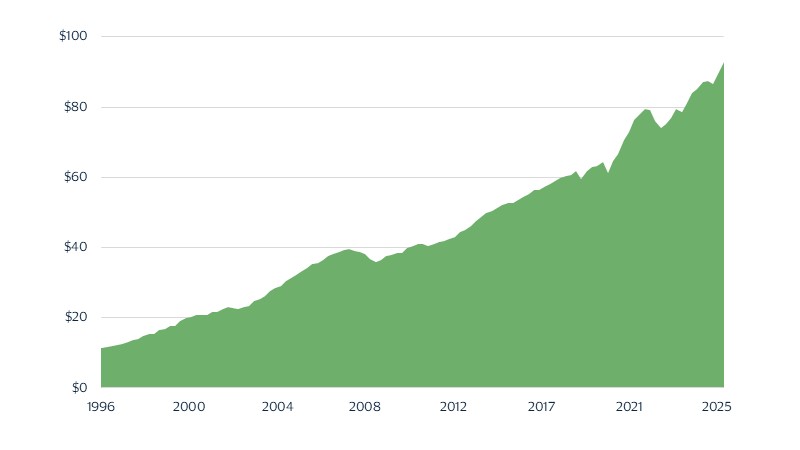
Here is what we know: baby boomers are sitting on at least $93 trillion in assets (see figure below). That’s more than the total held by Gen X and millennials combined. To put that into context, U.S. GDP was roughly $31 trillion in 2025, which means boomer assets are more than three times the size of the economy. But not all $93 trillion will make it to heirs, and even less will be spent. Imagine you are sitting on a winning lottery ticket. You hit the jackpot, but you immediately lose half by—smartly—taking the lump sum. Next, you lose another 30–40 percent through taxes and fees. The advertised jackpot is enormous, but after the lump-sum haircut, taxes and fees, the take‑home number is much lower. A similar dynamic applies to the great wealth transfer.
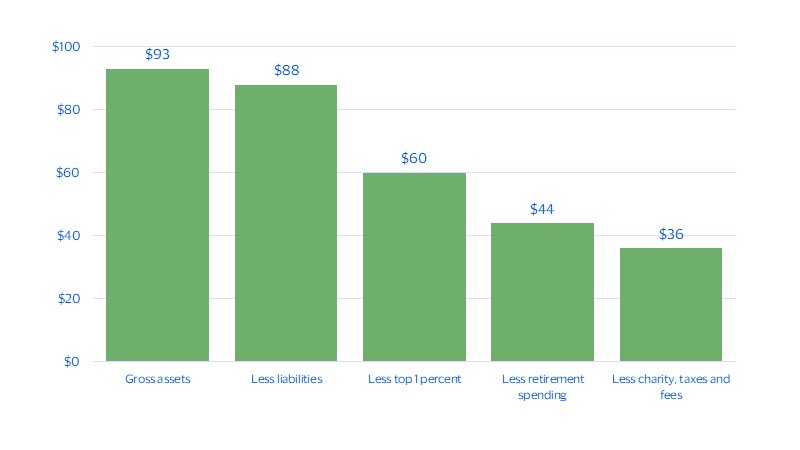
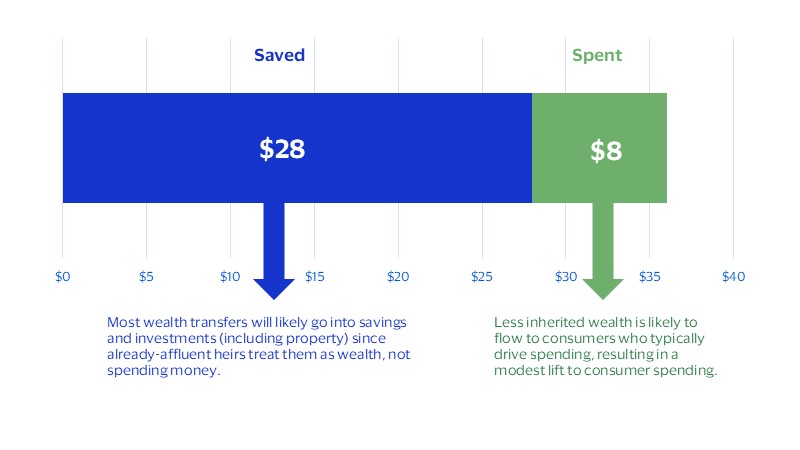
New research from Visa Business and Economic Insights finds that $36 trillion in baby boomer wealth will pass to Gen X and millennial heirs over the next 20 years after subtracting liabilities, excluding the top 1 percent of households (the outliers in how they spend their wealth), and accounting for retirement spending, charitable bequests, taxes and fees. That is a little over one‑third of the $93 trillion headline figure, and by our estimate the amount spent will be smaller still at $8 trillion,* because most households receiving an inheritance are already affluent and likely to save or invest much of what they receive. Even so, that roughly $8 trillion still has meaningful implications at the spending‑category level, especially in housing and travel, where support is already arriving through down‑payment assistance, skip‑generation vacations and similar wealth transfers happening now rather than far off in the future.
Baby boomers are sitting on $93 trillion in assets, but heirs will see far less
Trillions of dollars
With great assets come great liabilities
Debt is the first reminder that not all assets translate into inherited wealth.
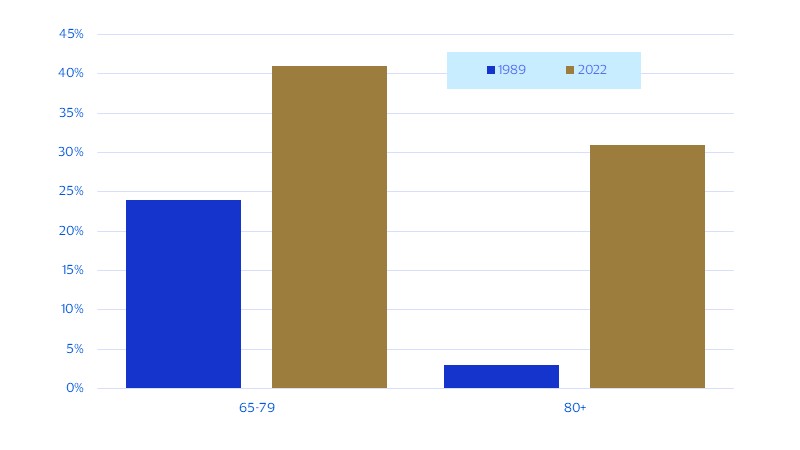
They may be the wealthiest generation in history, but baby boomer financial security is far from universal. Many older Americans still carry mortgage debt into retirement—41 percent of homeowners ages 65 to 79 and 31 percent of those 80 and older (see figure below). Among older homeowners, those with mortgages are substantially more likely to struggle with housing affordability than those who own their homes outright. Nearly half of mortgage-holding households headed by someone 65 or older face moderate-to-severe cost burdens, meaning they devote between 30 and 50 percent—or even more—of their income to housing costs.¹
Many boomers carry mortgages into retirement
Share of older homeowners with mortgage debt
Gross dreams meet net reality—the real number reaching Gen X and millennial heirs over the next 20 years
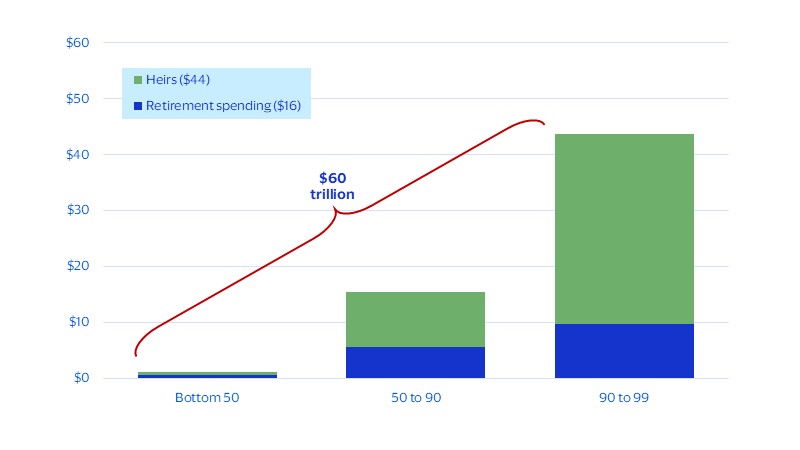
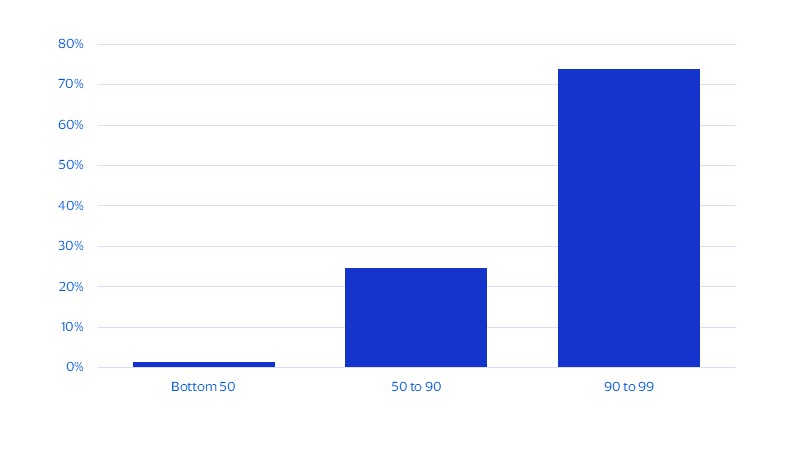
We started with $93 trillion in assets, and after subtracting liabilities we’re left with $88 trillion. This is still a substantial amount to be sure, but nearly one-third of this is held by the top 1 percent of households—funding yachts and private jets and destined largely for charitable foundations. Excluding them leaves $60 trillion in aggregate baby boomer wealth and gives a cleaner read of the transfer for the typical household and the potential lift to spending. But while excluding the top 1 percent makes the wealth estimate more realistic, it does not make the transfer democratic. The chart below shows that most remaining wealth ($44 trillion) is still held by affluent boomers in the top 90 to 99 percent of households. In contrast, the bottom 90 percent of boomer households hold just $16 trillion.
After accounting for retirement spending, $44 trillion in wealth remains for heirs
Net wealth† of baby boomers (trillions of dollars)
$93 trillion in assets whittled down to $36 trillion in inheritances
Net wealth of baby boomers (trillions of dollars)
Most wealth will flow to the already wealthy
Most inherited dollars will be saved or invested, rather than spent.
With most wealth transfers coming from affluent households, the heirs receiving them are disproportionately likely to be affluent as well. That reflects a broader intergenerational pattern: wealth, education, housing access, family support and inheritance expectations often reinforce one another across families. Our analysis finds that nearly 75 percent of those benefiting from the wealth transfer already have a higher net worth (see figure below).
Affluence begets affluence—most wealth transfer recipients already have a higher net worth
Distribution of those receiving an inheritance (percent)
$36 trillion is being passed down over the next 20 years, but only $8 trillion will be spent
Aggregate wealth transfers saved vs. spent by heirs (trillions of dollars)
Planning for the inheritance spending lift
Inherited wealth adds a new layer to spending growth.
An $8 trillion spending lift is large in dollar terms, but small relative to the size of the U.S. consumer economy. Under our baseline forecast, real consumer spending will grow an average of 2 percent per year over the next 20 years. Spread across that large spending base, the $8 trillion expected to be spent from inherited wealth lifts average annual growth by about 0.1 percentage points to 2.1 percent. That makes the transfer an incremental tailwind to overall consumption, rather than a new engine of growth.
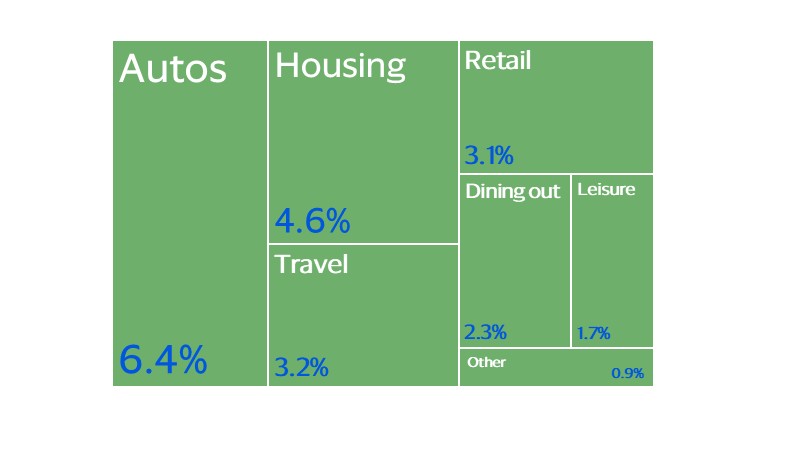
The bigger impact will show up beneath the headline number, across spending categories that benefit from affluent spending. Transportation, housing, travel and retail are expected to see some of the largest boosts, reflecting a mix of large-ticket necessities, pent-up demand and experience-first consumer behavior (see figure below). Housing is a clear example: more than half of individuals expecting to receive an inheritance say it is critical to their long-term financial security, including the ability to purchase a home—that figure rises to 69 percent for millennials.² Automobiles are another major beneficiary, with spending on vehicles and related expenses such as insurance, maintenance, repairs and gasoline expected to see the largest average annual lift. The transfer will also support categories tied to experiences. Consumers, especially millennials, have increasingly prioritized spending on travel, dining out and leisure, and inherited wealth is likely to reinforce that shift. As a result, the inheritance lift may be modest in the aggregate, but it will still create meaningful opportunities for businesses in categories where consumers are already looking to spend.
Transportation, housing, travel and retail will receive the largest annual spending boosts
Average annual inheritance lift for select categories from 2026 through 2045 (percent)
More boomers are giving while living
The inheritance spending lift is happening now.
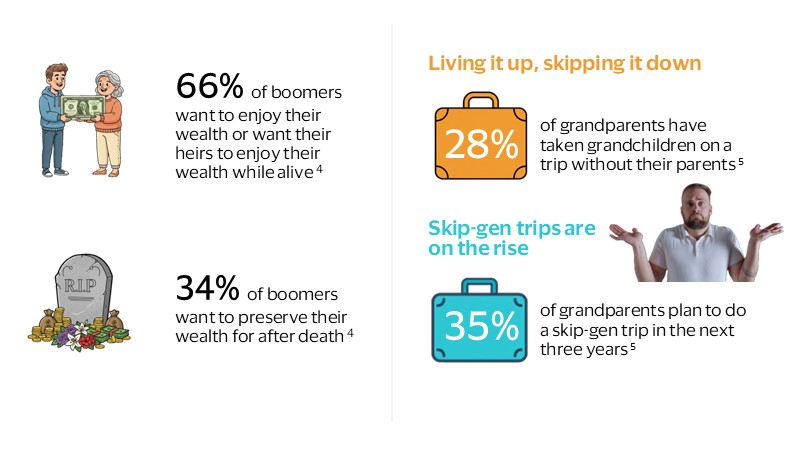
The great wealth transfer is not just a future event. It is already showing up in how families spend today, especially on housing and experiences. Among millennial homeowners, 1 in 4 received down payment assistance from their parents, and 26 percent said they would not have been able to buy their current home when they did without that help.³ For many, this support made it possible to qualify for a mortgage, lower their monthly payments or afford a more expensive home. It also reflects a broader shift among older generations toward giving while living. Rather than waiting to pass down inheritances later, many boomers are using their wealth to help their children clear major financial hurdles now, when the support will have the greatest impact.
That same desire to see their wealth make an immediate difference also shows up in travel. Rather than treating family wealth only as something to preserve or pass down later, boomers are using it to create shared experiences now. Skip-generation trips, where grandparents travel with grandchildren without their parents, are a clear example of how the wealth transfer is not just about money. These trips turn wealth into time together, shared memories and a way to pass down values across generations. This is not the old inheritance story. The $8 trillion spending lift is not only a boost to consumption, it is a window into how values, experiences and family support are reshaping the way wealth is used.
The kids are alright
Gen X and millennial heirs are starting from a position of strength.
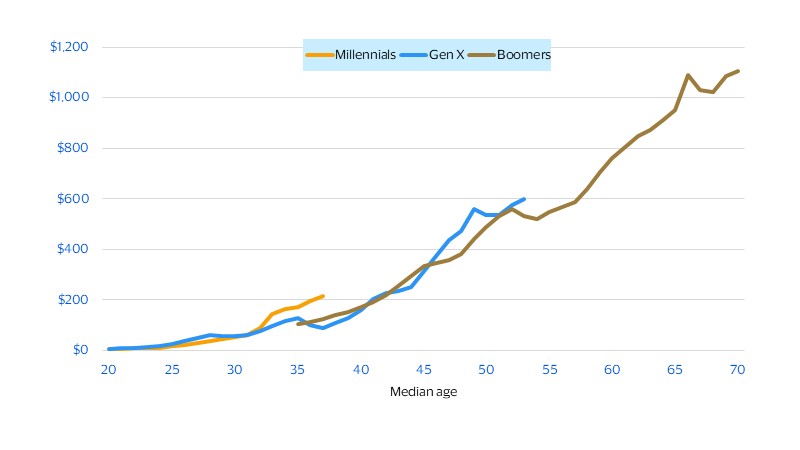
While they’re often discussed through the lens of strain, Gen X and millennials are entering the great wealth transfer from a stronger wealth position than boomers had at the same age. The figure below shows inflation-adjusted net worth per person across generations at comparable ages. Gen X and millennials have built more wealth than boomers did at the same age, largely due to several structural advantages. They’ve had earlier access to 401(k)s—often with automatic enrollment—and to modern, low-cost digital investing apps, enabling earlier years of compounding. Additionally, some benefited from historically low mortgage rates, driving significant home equity gains. That stronger starting point matters because inherited wealth is unlikely to land in the same way across households. For some, it will reinforce already strong balance sheets; for others, it will create the financial room to make purchases that have been delayed or out of reach.
The biggest shares are expected to go to households that are already near the top of the wealth distribution. For those heirs, an inheritance is more likely to be folded into investment accounts, retirement savings, trusts or other long-term assets than spent right away. But heirs outside the top wealth tiers are expected to receive smaller amounts overall and are more likely to put that money to work quickly in the real economy, whether by buying a home, paying down debt, renovating, replacing a car, traveling or helping their own children. That distinction is central to understanding the inheritance lift. The transfer will not create an even spending boost across all households. Instead, it will likely create a large savings and investment effect among wealthier heirs, alongside a more visible spending effect among households where an inheritance can meaningfully change near-term choices. For businesses, the opportunity is not only in the size of the transfer, but in identifying where inherited dollars can unlock purchases consumers already want or need to make.
Gen X and millennials are ahead of boomers on per capita wealth at the same age
Real net worth per capita by age (thousands of dollars)
* $8 trillion estimate calculated by applying group-level inheritance shares to corresponding marginal propensities to spend.
† Assumes an average annual real portfolio return of 1.8 percent over 20 years, and different retirement spending rates by percentile group.
Footnotes
- Visa Business and Economic Insights and Harvard University Joint Center for Housing Studies.
- Visa Business and Economic Insights and Northwestern Mutual.
- Visa Business and Economic Insights and LendingTree.
- Visa Business and Economic Insights and Charles Schwab.
- Visa Business and Economic Insights and U.S. Family Travel Survey (2025).
Forward-Looking Statements
This report may contain forward-looking statements within the meaning of the U.S. Private Securities Litigation Reform Act of 1995. These statements are generally identified by words such as “outlook”, “forecast”, “projected”, “could”, “expects”, “will” and other similar expressions. Examples of such forward-looking statements include, but are not limited to, statements we make about Visa’s business, economic outlooks, population expansion and analyses. All statements other than statements of historical fact could be forward-looking statements, which speak only as of the date they are made, are not guarantees of future performance and are subject to certain risks, uncertainties and other factors, many of which are beyond our control and are difficult to predict. We describe risks and uncertainties that could cause actual results to differ materially from those expressed in, or implied by, any of these forward-looking statements in our filings with the SEC. Except as required by law, we do not intend to update or revise any forward-looking statements as a result of new information, future events or otherwise.
Disclaimers
The views, opinions, and/or estimates, as the case may be (“views”), expressed herein are those of the Visa Business and Economic Insights team and do not necessarily reflect those of Visa executive management or other Visa employees and affiliates. This presentation and content, including estimated economic forecasts, statistics, and indexes are intended for informational purposes only and should not be relied upon for operational, marketing, legal, technical, tax, financial or other advice and do not in any way reflect actual or forecasted Visa operational or financial performance. Visa neither makes any warranty or representation as to the completeness or accuracy of the views contained herein, nor assumes any liability or responsibility that may result from reliance on such views. These views are often based on current market conditions and are subject to change without notice.
Visa’s team of economists provide business and economic insights with up-to-date analysis on the latest trends in consumer spending and payments. Sign up today to receive their regular updates automatically via email.