Chocolate trails and beauty tales: ‘Goods getaways’ are on the rise
February 2025 – Travelers are increasingly planning trips around purchases of unique items that are difficult to find in their home countries, such as French perfumes, Korean cosmetics or Swiss chocolates. Based on an anonymized analysis of VisaNet data, we looked at two examples of so-called ‘goods getaways’—travel involving a brand-name Dubai chocolate bar that gained global popularity and Korean beauty products. In both instances, we found evidence of increased tourist spending on these unique products that are closely associated with the travel destination. The data suggests that the availability of specialty items in a specific locale is not a travel coincidence or added bonus, but rather a key motivator of tourists’ destination choices and a novel, rising trend in global tourism.
The travel and tourism industry is increasingly being shaped by the intersection of several technological and demographic factors. Every day, new users gain access to the internet—in 2023, an estimated 97 million logged on for the first time.¹ Gen Z, a digitally native generation that has only ever known a world with smartphones, social media and high-speed internet, represented a quarter of the world’s population in 2024. By 2030, they are projected to account for 30 percent of all travelers.² These shifts are redefining not only how people travel, but also who travels and what motivates their journeys—with ‘goods getaways’ becoming a new and significant driver of travel planning.
The frenzy over “the“ Dubai chocolate bar
It’s not just any chocolate from Dubai. A particular brand of knafeh and pistachio-filled chocolate bar took social media by storm in 2024, prompting a plethora of videos online of influencers unwrapping and trying the gooey goodness. One clever way the makers of the chocolate bar marketed their product was by offering a limited amount exclusively on Deliveroo, a food delivery app, for only two short windows of time: at 2 p.m. and 5 p.m. This scarcity, coupled with social media savviness, contributed to the overwhelming demand.
We looked at the distribution of transactions on Deliveroo before and after the chocolate bar gained popularity to track the evolution of spending. To capture tourist spending, we limited the analysis to non-domestic bank cards. The distribution of transactions before the chocolate bar went viral followed the expected path with a couple of peaks—one around lunch time at 1 p.m., and the other around dinner time at 7 p.m. and 8 p.m.—before the number of transactions tapered off.
The Dubai chocolate bar’s popularity drove new, distinct transaction peaks on Deliveroo
Distribution of transactions by time of day on Deliveroo in the U.A.E., non-domestic cards, Q4-2023 vs. Q4-2024
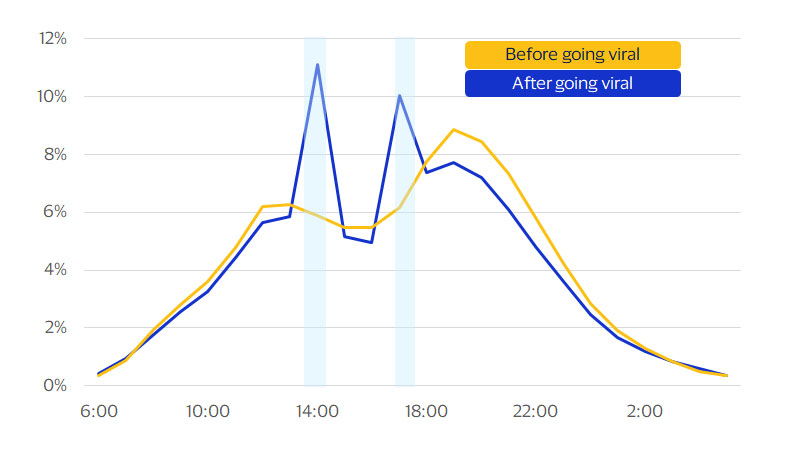
Interestingly, as the chocolate bar gained popularity, the distribution of transactions changed significantly. In fact, the distribution on Deliveroo was not what you’d typically expect for tourists’ food deliveries, with unusual peaks at 2 p.m. and 5 p.m.—the windows at which the chocolate bars were sold—suggesting a significant share of the transactions at 2 p.m. and 5 p.m. were for the purchase of the viral chocolate.
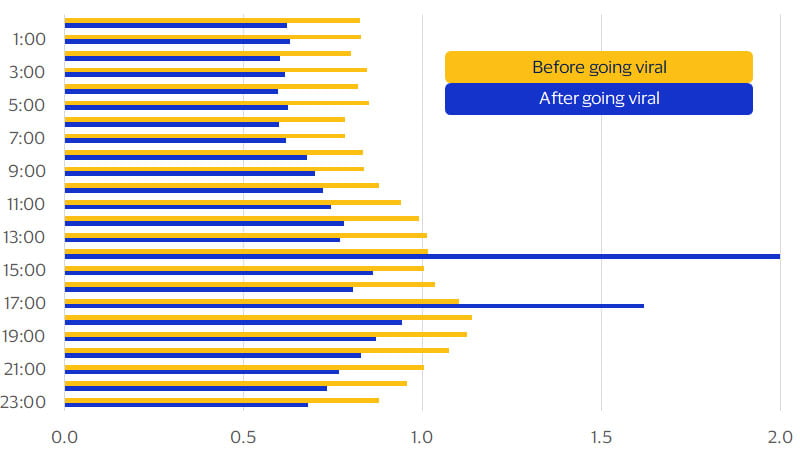
The average transaction size also shifted. For food delivery apps, this typically aligns with the daily average, with some minor fluctuations from hour to hour. But, as the chocolate bar went viral, the average transaction size peaked at twice the daily average at 2 p.m. and 1.6x at 5 p.m., further evidence that the chocolate bar drove the additional spending (see figure below). The top non-domestic spenders at 2 p.m. and 5 p.m. were cardholders from the U.K., the U.S., Kazakhstan, Kuwait and Saudi Arabia. Interestingly, cardholders from Singapore, South Korea and Armenia, who aren't usually big spenders on Deliveroo in the U.A.E., also significantly increased their spending during the 2 p.m. and 5 p.m. windows.
Average spending at 2 p.m. and 5 p.m., when the Dubai chocolate bar was sold, jumped significantly
Average transaction size for non-domestic cards on Deliveroo, benchmarked vs. daily average transaction, Q4-2023 vs. Q4-2024
Glamorous getaways: The K-beauty boom
Another category of ‘goods getaways’ that has gained popularity is Korean beauty products, popularized by the rise of K-culture and known for their innovation, high-quality and affordability.
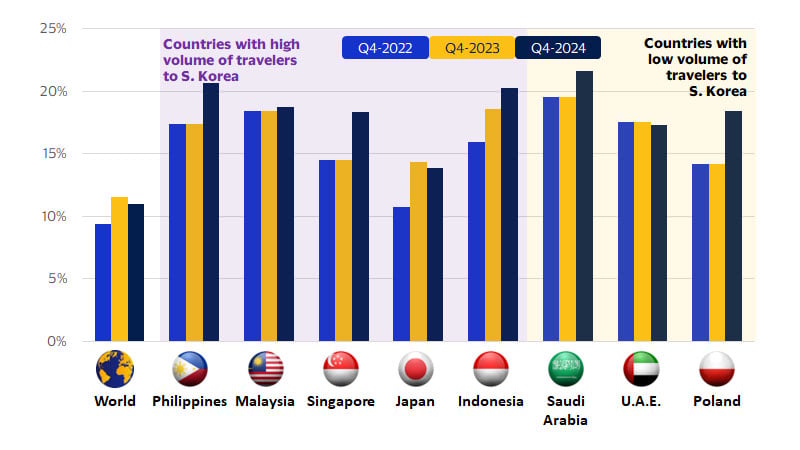
We again limited our analysis to non-domestic card spending and included only in-person transactions at Korean cosmetic and skincare shops in South Korea. Generally, we observed a modest rise in the share of total international cardholders spending in those shops, from 9.4 percent of total non-domestic cards in Q4-2022 to 11 percent in Q4-2024. Interestingly, though, there was significant variation depending on travelers’ countries of origin, suggesting the trend is more popular in certain countries than others.
Korean beauty products have developed an avid fanbase in neighboring countries like the Philippines, Malaysia, Singapore, Japan and Indonesia. By Q4-2024, 1 in 5 travelers from the Philippines and Indonesia had transacted in-person at cosmetic and skincare shops in South Korea. Shares of cardholders traveling from Malaysia, Singapore and Japan were only slightly lower—at 19 percent, 18 percent and 14 percent, respectively. Travelers from countries that are geographically distant but have a strong interest in beauty and cosmetic products have increased their in-person participation in beauty spending as well.³ For example, 22 percent of travelers from Saudi Arabia and 17 percent of travelers from the U.A.E. have used their cards in cosmetic shops in South Korea. For most of the countries studied, the share of travelers using their cards to purchase Korean beauty products was higher in Q4-2024 than in Q4-2022.
Korean cosmetic and skincare products are gaining popularity near and far
Share of non-domestic cards with in-person spending at cosmetic and skincare shops in S. Korea, by travelers’ country of origin
From souvenirs to strategy
The ‘goods getaway’ trend presents opportunities for both banks and merchants. For banks, understanding the spending behaviors of tourists can lead to more targeted marketing strategies and personalized offers that cater to these novel travel motivations. By analyzing transaction data, banks can identify high-spending tourist segments and offer tailored financial products such as travel rewards cards or exclusive discounts with partner merchants in popular travel destinations.
Merchants, on the other hand, can capitalize on this trend by strategically positioning their products to attract these travel-motivated consumers. For example, retailers in popular ‘goods getaway’ destinations, such as Dubai, Paris or Seoul, can create exclusive product lines or limited-time offers that align with the preferences of international tourists. Collaborating with influencers and leveraging social media platforms can further amplify the appeal of these unique products, driving both online and in-store traffic.
Footnotes
- DataReportal. (2024). Digital 2024: Deep Dive—The State of Internet Adoption.
- Vogue Business. (n.d.). How to capture the beauty spend of Gen Z travellers.
- McKinsey & Company. The beauty boom and beyond: Can the industry maintain its growth?
Forward-Looking Statements
This report may contain forward-looking statements within the meaning of the U.S. Private Securities Litigation Reform Act of 1995. These statements are generally identified by words such as “outlook”, “forecast”, “projected”, “could”, “expects”, “will” and other similar expressions. Examples of such forward-looking statements include, but are not limited to, statements we make about Visa’s business, economic outlooks, population expansion and analyses. All statements other than statements of historical fact could be forward-looking statements, which speak only as of the date they are made, are not guarantees of future performance and are subject to certain risks, uncertainties and other factors, many of which are beyond our control and are difficult to predict. We describe risks and uncertainties that could cause actual results to differ materially from those expressed in, or implied by, any of these forward-looking statements in our filings with the SEC. Except as required by law, we do not intend to update or revise any forward-looking statements as a result of new information, future events or otherwise.
Disclaimers
The views, opinions, and/or estimates, as the case may be (“views”), expressed herein are those of the Visa Business and Economic Insights team and do not necessarily reflect those of Visa executive management or other Visa employees and affiliates. This presentation and content, including estimated economic forecasts, statistics, and indexes are intended for informational purposes only and should not be relied upon for operational, marketing, legal, technical, tax, financial or other advice and do not in any way reflect actual or forecasted Visa operational or financial performance. Visa neither makes any warranty or representation as to the completeness or accuracy of the views contained herein, nor assumes any liability or responsibility that may result from reliance on such views. These views are often based on current market conditions and are subject to change without notice.
Visa’s team of economists provide business and economic insights with up-to-date analysis on the latest trends in consumer spending and payments. Sign up today to receive their regular updates automatically via email.