Finding a way in Asia Pacific's new economic reality

Asia Pacific Annual Economic Outlook

January 2025 – Welcome to Asia’s new economic reality. A year of uncertainty and structural change looms in 2025: The new U.S. administration is likely to take a different approach to this highly trade-exposed region, and authorities in Mainland China are calibrating stimulus to accelerate growth and inflation in the region’s largest economy. Amidst the background of decent global growth, we are watching four key themes in Asia Pacific for the year ahead:

  1. Consumer-led recovery: Asia Pacific can look forward to a consumer recovery, in both real and nominal spending.
  2. Geopolitics: A new administration in the U.S. increases uncertainty in an already volatile region.
  3. Supply chain shifts: Asia Pacific will continue to integrate deeply into global supply chains.
  4. New financial flows: All these shifts in trade and investment patterns are leading to billions of dollars of new financial flows, as remittances, trade financing and foreign exchange flows follow the realignments.

Consumer markets in Asia Pacific will be stronger in 2025

In some economies, such as Australia and Japan, what spending growth there was in 2024 was almost entirely due to inflation (see figure below). In 2025, battered consumers will be more likely to open their wallets as inflation continues to come down in response to the recent interest rate hike cycle. The rebound will only be moderate, however: The high level of prices will still register strongly in consumer psyches, even if the rate of inflation drops. Inflation will notably ease in the Philippines and India, as long as the good harvests that are expected materialize. This will have the added benefit of increasing rural incomes. In other economies, tight labour markets in places such as Hong Kong and Japan have led to persistent wage increases, and this feeling of security should entice people to spend more in the year ahead. In the case of Hong Kong, however, a portion of the increased activity will continue to be spent across the border in Shenzhen, mirroring the increasing proclivity of people in Asia Pacific to look abroad to take advantage of price differentials. This works to the advantage of economies like Japan and Malaysia. The largest risk for consumer spending comes in the form of housing, where highly indebted households in markets such as Australia, Mainland China, Malaysia and South Korea tend to cut back spending in response to higher interest rates or falling house prices.

Places like Vietnam and India are expected to have robust local-currency spending
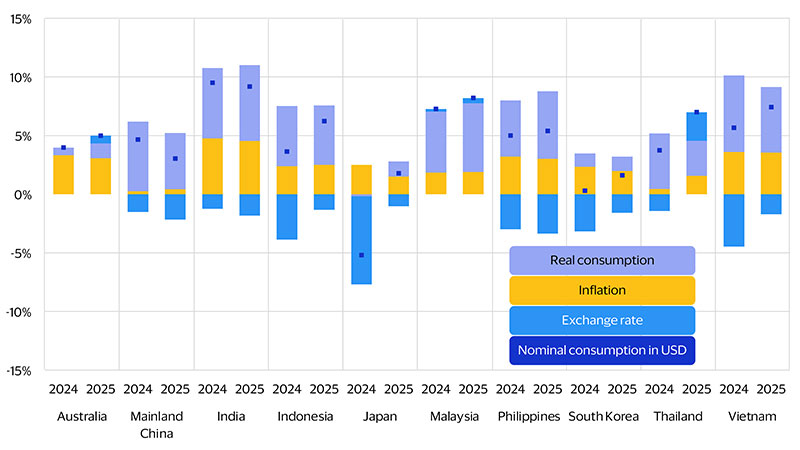
Components of USD nominal private consumption growth (percent, year ago)
Places like Vietnam and India are expected to have robust local-currency spending. See image description for details.

Source: Visa Business and Economic Insights analysis of Oxford Economics data

Stacked bar chart showing the components of USD nominal personal consumption year-over-year growth expected in 2025 vs 2024 by country. Australia’s growth is expected to increase from 4% in 2024 to 5% in 2025, with inflation representing 3% both years, real consumption increasing to 1% from .65% in 2024, and the exchange rate increasing to 1% from 0% in 2024. Mainland China’s YoY PCE growth is expected to decline from 5% to 3%, with inflation representing .4% (from .3%), real PCE representing 5% (from 6%) and the exchange rate representing -2% (from -2%). India’s YoY PCE growth is expected to decline from 10% to 9%, with inflation representing 5% (from 5%), real PCE representing 6% (from 6%) and the exchange rate representing -2% (from -1%). Indonesia’s YoY PCE growth is expected to increase from 4% to 6%, with inflation representing 2.5% (from 2.4%), real PCE representing 5% (from 5%) and the exchange rate representing -1% (from -4%). Japan’s YoY PCE growth is expected to increase from -5% to 2%, with inflation representing 1.5% (from 2.5%), real PCE representing 1% (from -2%) and the exchange rate representing -1% (from -8%). Malaysia’s YoY PCE growth is expected to increase from 7% to 8%, with inflation representing 1.9% (from 1.8%), real PCE representing 6% (from 5%) and the exchange rate representing 0% both years. Philippines’s YoY PCE growth is expected to be flat at 5%, with inflation representing 3% both years, real PCE representing 6% (from 5%) and the exchange rate representing -3% both years. South Korea’s YoY PCE growth is expected to increase from 0% to 2%, with inflation representing 2% (from 2%), real PCE representing 1% (from 1%) and the exchange rate representing -2% (from -3%). Thailand’s YoY PCE growth is expected to increase from 4% to 7%, with inflation representing 2% (from .4%), real PCE representing 3% (from 5%) and the exchange rate representing 2% (from -1%). Vietnam’s YoY PCE growth is expected to increase from 6% to 7%, with inflation representing 4% both years, real PCE representing 6% (from 7%) and the exchange rate representing -2% (from -4%).

Geopolitics continue to take centre stage

The recent trend of U.S.-China relations becoming more fraught seems set to continue, yet with the possibility for new agreements as well as new disputes. Active middle powers such as India, Russia and Japan will further complicate the environment for business, as will the ongoing toughening of the broader regulatory environment and activist stance of governments in directing economic activity to align with national goals, for example in critical minerals, semiconductors, electric vehicles (EVs) or batteries. Trade-reliant economies such as Vietnam, Japan, Taiwan and South Korea will face uncertainty around market access.

Asia Pacific supply chains are reshaped by geopolitics

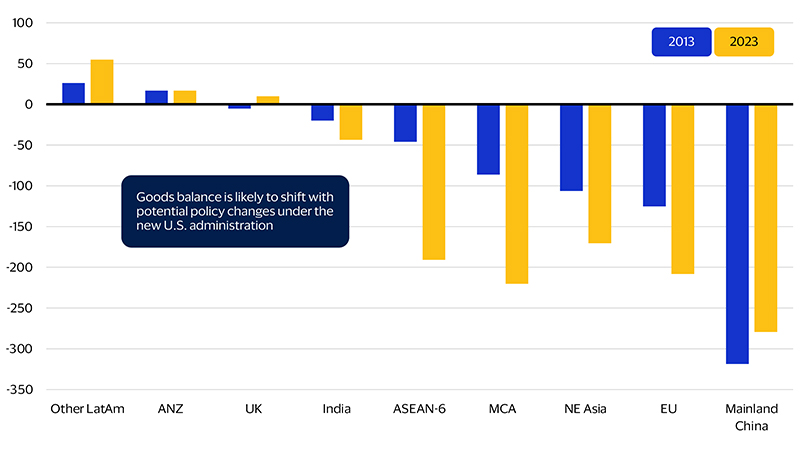
For years, U.S. and Chinese firms have led the creation of new supply chains to reduce risk and take advantage of changing patterns of cost and technological capabilities, as well as developments in bilateral relations. For instance, over the last decade, the U.S. trade deficit has grown by 54 percent but the size of the deficit with Mainland China has shrunk. India and ASEAN’s trade deficit has risen by a much larger than average amount (see figure below). These new supply chains will likely face a changing regulatory environment in 2025. Underlying demand for Asia’s exports will continue to be heavily influenced by the AI-driven boom in semiconductors and related parts of the electronics industry. While the AI boom will likely moderate somewhat in 2025, regional exporters should still see good demand for their products.

U.S. trade has undergone structural change over the last decade

U.S. goods trade balance (nominal billion U.S. dollar)
U.S. trade has undergone structural change over the last decade. See image description for details.

Source: Visa Business and Economic Insights analysis of United States Census Bureau data

Bar chart showing the U.S. goods trade balance by country in 2023 vs. 2013, including South and Central America excluding Mexico more than doubling from 25.9 bil. to 54.9 bil., Australia and New Zealand remaining flat at 16.8 bil., the U.K. increasing from -5.4 bil. to 9.8 bil., India increasing from -20 bil. to -43.7 bil., the ASEAN-6 (Indonesia, Malaysia, Vietnam, Thailand, Philippines, and Singapore) increasing from -46.1 bil. to -190.8 bil., MCA (Mexico and Canada) increasing from -86.4 bil. to -220.2 bil., NE Asia (Japan, South Korea and Taiwan) increasing from -106.5 bil. to -170.5 bil., the EU increasing from -125.4 bil. to -208.2 bil., and Mainland China decreasing from -318.7 bil. to -279.4 bil.

Note: ANZ, Australia and New Zealand; NE Asia, Japan, South Korea and Taiwan; MCA, Mexico and Canada; EU, European Union; ASEAN-6, Indonesia, Malaysia, Philippines, Singapore, Thailand, Vietnam; Other LatAm, South and Central America excl Mexico; United Kingdom

Financial flows are following shifts in supply chains

As the U.S. Federal Reserve embarked on its rate-hiking cycle in recent years, most Asia Pacific currencies have depreciated, particularly consequentially in the large economies of Japan, Mainland China and South Korea. Both emerging patterns of cost differentials and regulation are driving investment, such as in production facilities in Japan, and sourcing of components cross border, such as China’s surging exports to Southeast Asia. As the U.S. Fed continues to cut interest rates, any central bank holding rates constant or cutting slowly, such as in Malaysia or Thailand, should see currency appreciation. This will reduce export competitiveness even as it increases the spending power of local consumers.

So how will the region’s largest economies do in 2025? Asia Pacific will remain the world’s fastest-growing region, even as Mainland China’s economy slows against a mix of structural headwinds, such as a decline in the size of the workforce and weak confidence amid a property slump. Mainland China will be one of the few governments in the region embarking on fiscal stimulus rather than consolidation. This boost to spending could help to stave off deflation and manage a highly indebted property sector, making it countercyclical to much of the rest of the region. Urbanisation remains the biggest driver of growth for Asia Pacific’s emerging economies and, combined with sufficient improvements to the business environment, will propel India, Vietnam and the Philippines to become standout markets for growth. Significant numbers of new consumers are moving into the middle class, with implications for retail and travel, in particular. Demographic change is rapidly occurring, and economies like Thailand and Vietnam are going to face challenges with healthcare, pensions and employment due to ageing populations at lower levels of gross domestic product per capita than Mainland China did, and it in turn is facing them earlier than Japan or South Korea did. Technological change remains a bright spot, with much of the global cutting-edge innovation, from semiconductors to EVs, taking place in regional economies.

Forward-Looking Statements 

This report may contain forward-looking statements within the meaning of the U.S. Private Securities Litigation Reform Act of 1995. These statements are generally identified by words such as “outlook”, “forecast”, “projected”, “could”, “expects”, “will” and other similar expressions. Examples of such forward-looking statements include, but are not limited to, statements we make about Visa’s business, economic outlooks, population expansion and analyses. All statements other than statements of historical fact could be forward-looking statements, which speak only as of the date they are made, are not guarantees of future performance and are subject to certain risks, uncertainties and other factors, many of which are beyond our control and are difficult to predict. We describe risks and uncertainties that could cause actual results to differ materially from those expressed in, or implied by, any of these forward-looking statements in our filings with the SEC. Except as required by law, we do not intend to update or revise any forward-looking statements as a result of new information, future events or otherwise.

Disclaimers

The views, opinions, and/or estimates, as the case may be (“views”), expressed herein are those of the Visa Business and Economic Insights team and do not necessarily reflect those of Visa executive management or other Visa employees and affiliates. This presentation and content, including estimated economic forecasts, statistics, and indexes are intended for informational purposes only and should not be relied upon for operational, marketing, legal, technical, tax, financial or other advice and do not in any way reflect actual or forecasted Visa operational or financial performance. Visa neither makes any warranty or representation as to the completeness or accuracy of the views contained herein, nor assumes any liability or responsibility that may result from reliance on such views. These views are often based on current market conditions and are subject to change without notice.


Visa’s team of economists provide business and economic insights with up-to-date analysis on the latest trends in consumer spending and payments. Sign up today to receive their regular updates automatically via email.