Customer segmentation FIFA World Cup 2026™: Eight key data takeaways from the halfway mark
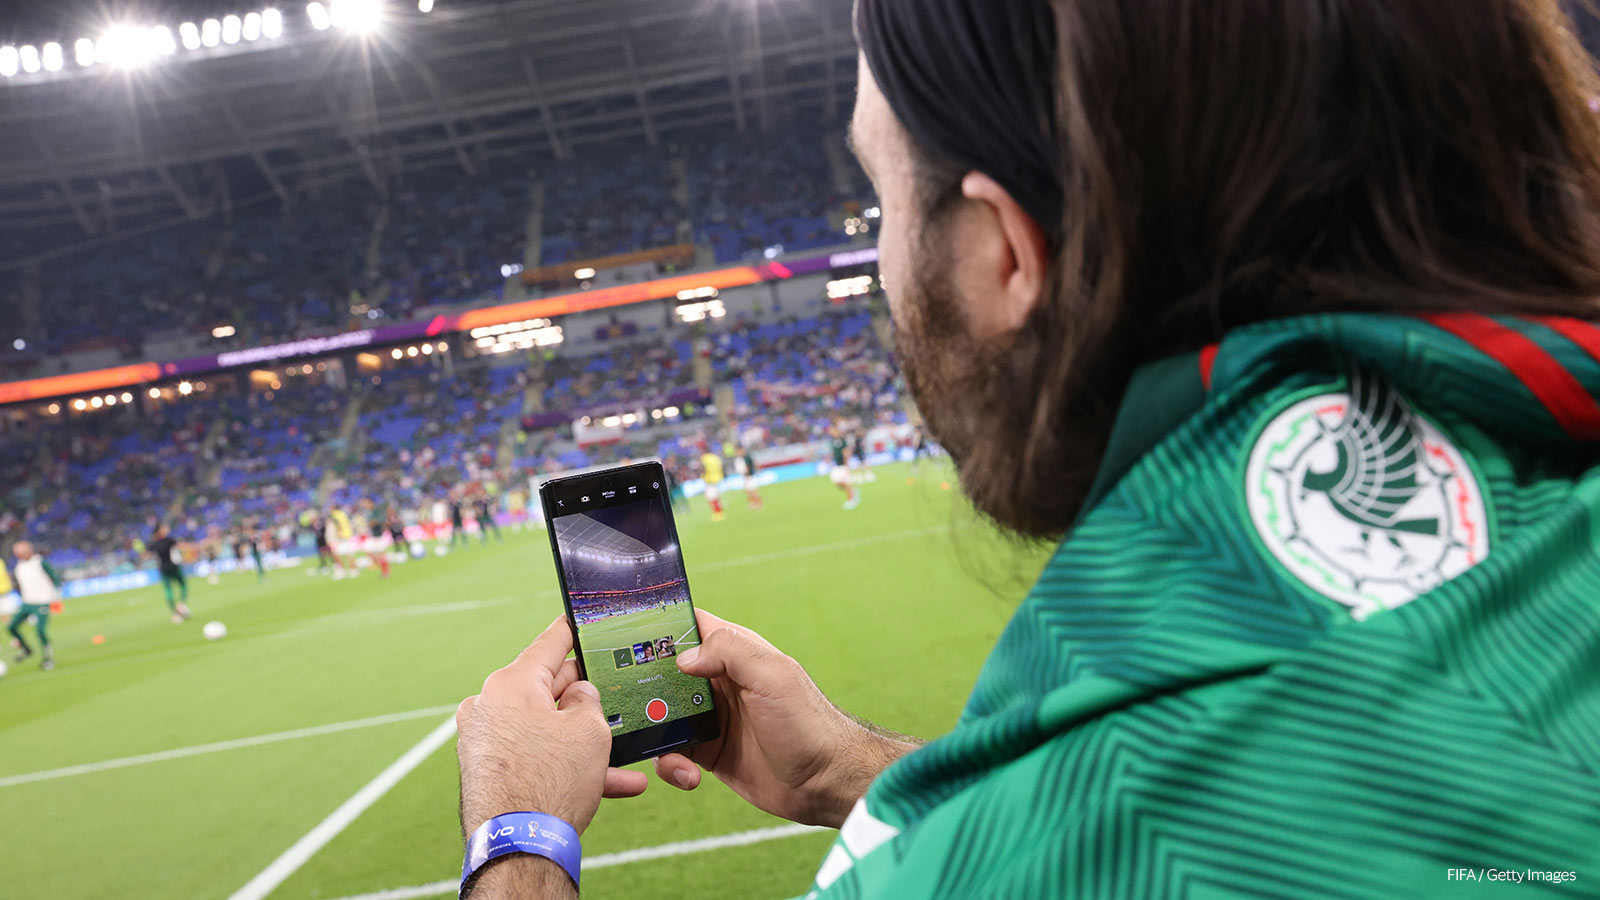
July 2026 – Where the FIFA 2026 World Cup™ is happening is most closely associated with its host countries, but given its digital reach to all corners of the world its footprint spans much more. Over a billion fans tuned in on televisions, mobile devices and streaming platforms, with many even adjusting their routines to follow the action. Their energy nearly matched the players on the pitch as they embraced their teams, shifted their schedules to make time for matches, and gathered with friends and family.
Many stories have covered the matches themselves. Our Visa spend data tells a different story: of how fans participated from afar, from their homes, workplaces and favorite gathering spots. Using aggregated transaction data from more than 80 countries (excluding the host countries), Visa Business and Economic Insights looked at how fans dipped, tapped, swiped and clicked from the early mornings through late nights to gauge at the mid-way point the impact of these games on consumers—a period when momentum was building but not yet peaked in the finals. What emerges is a familiar story in some cases: friends and family gathering at local pubs, restaurants and bars to share the joy and heartbreak with each goal. It is also a story of how electronic payments helped consumers enjoy the matches where it was most convenient for them. Here’s eight key insights we gleaned from the data.
Highlights:
- Insight I: 1.5 times more of a boost in consumer purchases during weekday vs. weekend matches
- Insight II: 62 percent gain in spending at restaurants, bars and coffee shops for fans closing out their bills after watching the matches live in prime time
- Insight III: 68 percent gain in food delivery and grocery online purchases as fans planned ahead for the early-morning matches
- Insight IV: 86 percent gain in online entertainment purchases immediately prior to daytime matches
- Insight V: Seven out of 10 countries saw spending rise during the Norway vs. Brazil match
- Insight VI: +143 percent more kroner spent domestically when Norway played Brazil
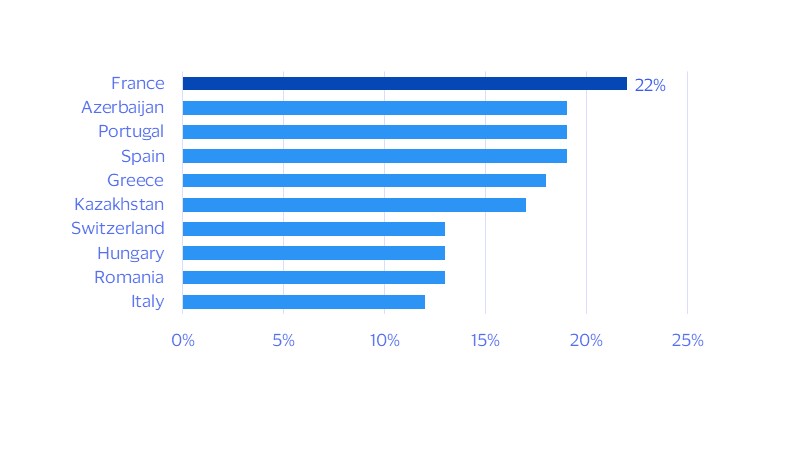
- Insight VII: +22 percent median lift in spending on food and food services by French fans through the Round of 16 matches
- Insight VIII: 10- to 20-basis-point boost to annual U.S. personal consumption expenditure growth in June (excluding gasoline)
Insight I: 1.5 times more of a boost in consumer purchases during weekday vs. weekend matches¹
What may come as a surprise is that weekday (as opposed to weekend) matches triggered a greater lift in spending relative to a typical day. (We define a match as the three hours before and after kickoff), This attests to the power of the matches to shift spending that would have occurred on the weekends—when consumers typically have the time to spend—to the weekdays, which are saved for more routine predictable spend. It’s not just daily spend that shifts, but also when spending occurs across categories.
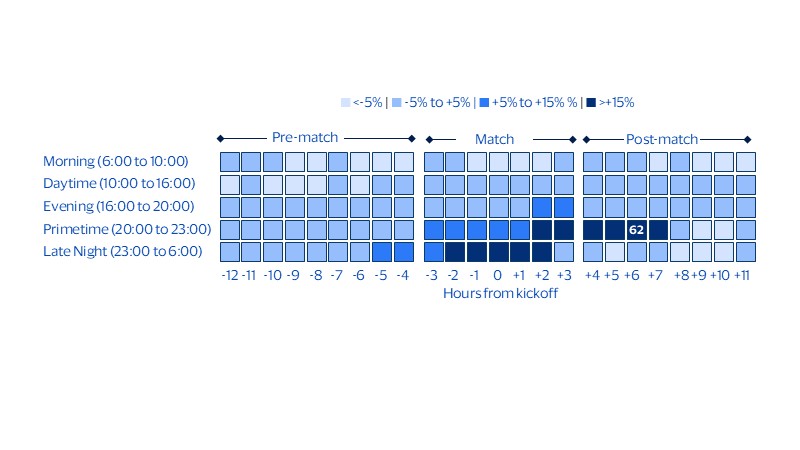
Insight II: 62 percent gain in spending at restaurants, bars and coffee shops for fans closing out their bills after watching the matches live in primetime
How fans experienced the matches was integrally linked to when the matches were broadcast live in their countries. When matches coincided with times fans usually relax, such as prime time or late night, they were more likely to gather outside their homes to catch the match together. The reverse was true for early-morning matches. To better capture these nuances, we centered our analysis around the time of kickoff for each market and then grouped them based on when the matches were broadcast locally, with primetime being when the matches were watched between 20:00 and 23:00. Here, spending tended to be weaker as fans likely delayed the start of their day and stayed home longer to catch the matches before heading to work (see figure below).
The maximum surge in spending at restaurants, bars and coffee shops occurred six hours after the match started for fans that were watching during primetime hours
Purchase transactions on match days vs. typical day (percent difference)
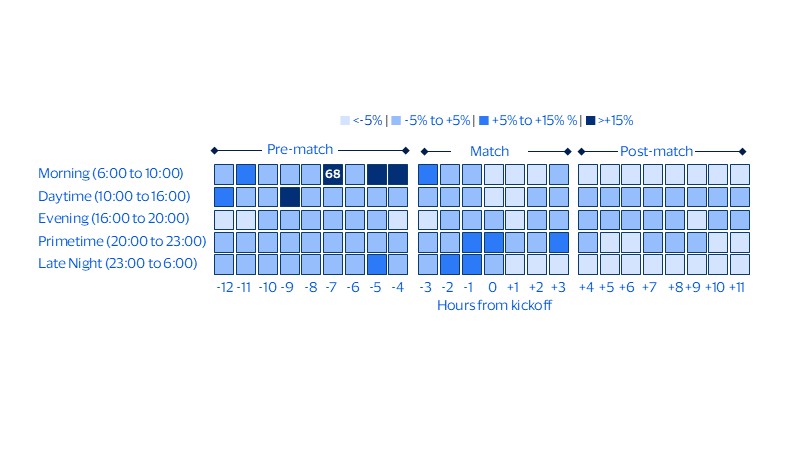
Insight III: 68 percent gain in food delivery and grocery online purchases as fans planned ahead for the early-morning matches
While fans watching early-morning games may seem lackluster based on their in-person spending at restaurants (see figure above), how they experience the games is much different. When it comes to ordering ahead for the early-morning matches, they excelled. They leveraged online apps, delivery services and payments to keep their homes well supplied into the wee hours ahead of the matches (see figure below).
Seven hours before the morning matches started, online delivery orders spiked for food and groceries
Purchase transactions on match days vs. typical day (percent difference)
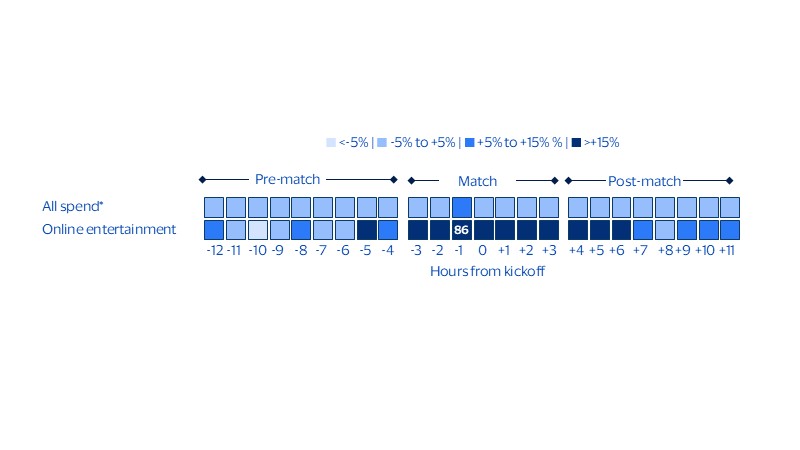
Insight IV: 86 percent gain in online entertainment purchases immediately prior to daytime matches
Spending shifted the least in daytime markets. For those unlucky fans watching during the regular 9 a.m. to 5 p.m. workday, avoiding spoilers while doing their jobs was part of the experience. Even on weekends, time spent watching the matches came at the expense of routines such as the weekly trip to stock up on groceries and other household chores. But even for this segment where work competes with leisure, we did see some significant shifts (see figure below) when it came to online spending on entertainment as fans purchased one-time passes, activated streaming subscriptions and upgraded internet access.
One hour before match start, fans in daytime markets loaded up on online entertainment buys
Purchase transactions on match days vs. typical day (percent difference)
Insight V: Seven out of 10 countries saw spending rise during the Norway vs. Brazil match
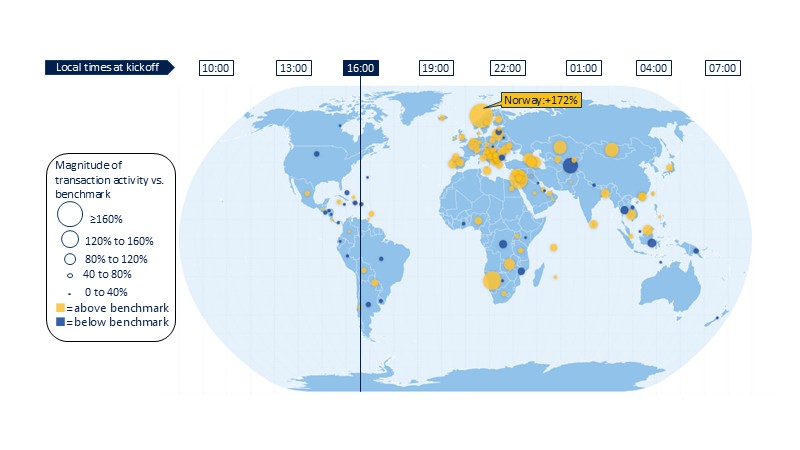
Among the Round of 16 matches, Norway vs. Brazil had the broadest reach when it came to bringing fans together through food spending during the match (see figure below). No matter whether they watched at home or elsewhere, fans came out in force from Oslo to Almaty. More than 70 percent of countries experienced a lift in spending on food and food services during the match. Among countries where the match aired on primetime, 96 percent saw an increase in spending.
The match that brought the world together: Norway vs. Brazil
Percent change in purchase transactions compared to a typical day (percent difference)
Insight VI: +143 percent more kroner spent domestically when Norway played Brazil
The stars were aligned for the Norway vs. Brazil match to command the world’s attention. It was a qualifying match for the quarterfinals, with Brazil, a global football heavyweight that has played in every FIFA World Cup™ on one side and Norway, seeking its first chance to enter the quarterfinals since 1998, on the other. Social media attention around the Norwegian team’s supporters and their endearing “Viking Row”—amplified by the buzz around Erling Haaland—helped build enthusiasm, which showed up in the progressive increase in Norwegian spending as the team advanced (see this chart in the full report).
Insight VII: +22 percent median lift in spending on food and food services by French fans through the Round of 16 matches
The fan base that was most engaged, as measured by the intensity and consistency of their spending increases across the Round of 16, was the French (see figure below). When France became the first team to secure a spot in the quarterfinals, fans turned their attention to who the team might face if it reached the semifinals. The Portugal vs. Spain and USA vs. Belgium matches both saw the largest lift in French spending. Azerbaijan was a close second to France when it came to how engaged its fans were as measured by their spending. That country’s spending especially stood apart from the rest when it came to the Morocco vs. Canada match.
Fans in France led other markets in matching their enthusiasm for football with their spending
Median lift in domestic purchases during matches vs. typical time period across Round of 16 matches (percent difference)
Insight VIII: 10- to 20-basis-point boost to annual U.S. personal consumption expenditure growth in June (excluding gasoline)
While the preceding insights focused on fans outside of the host countries, our final insight turns to the U.S. and our estimate of the possible economic impact of the 2026 FIFA World Cup™ in June. Conventional wisdom holds that the U.S. is not a “soccer” country, so it might seem odd to suggest that the matches could have boosted consumer spending growth by 10 to 20 basis points. Our research suggests that view may be outdated. A proprietary survey Visa fielded this past April found that the FIFA World Cup™ was less likely to draw older generations, with only 29 percent of boomers and seniors saying they were planning on watching it. But the reverse was true for younger generations: over half of Gen Z and millennial respondents planned to tune in. Unsurprisingly, most respondents across generations identified as fans of the U.S. team, but a good match is a good match—many were also likely to support teams from other countries, especially younger fans (see this chart in the full report).
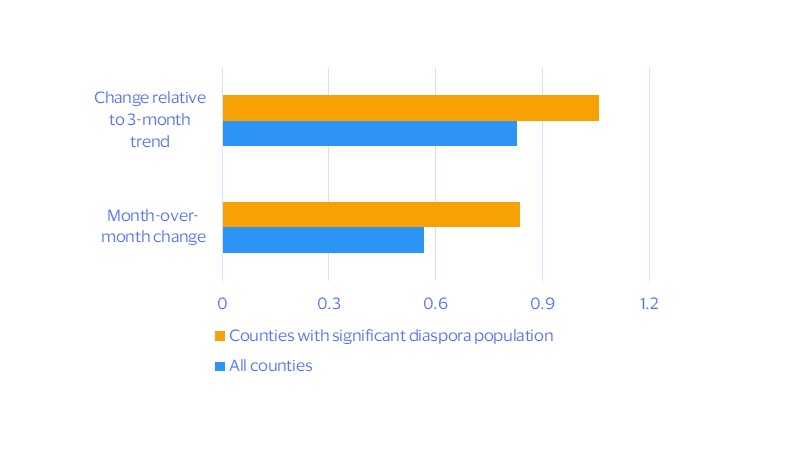
Some of this loyalty to other teams could be driven by star players, but heritage may also play a role. If a FIFA World Cup™ -induced spending boost was the goal, pride in home countries among immigrants in the U.S. provided a decisive assist. This pride showed up in the latest Visa Spending Momentum Index (SMI) readings for June: counties with a large share of foreign-born immigrants from participating countries saw a stronger month-on-month rise (see this chart in the full report). After controlling for underlying state-level spending conditions and gasoline-related spending trends, regression analysis implies that the FIFA World Cup™-linked foreign-born population in the U.S. boosted the SMI by 0.2 to 0.4 points during the qualifying stage of the tournament. That is consistent with a modest but statistically significant FIFA World Cup™-related boost to local consumer spending, a roughly 0.1- to 0.2-ppt lift to year-on-year PCE growth (see figure below).
After accounting for state-level differences in gas spending, the boost is clearer
Month-on-month changes in the Visa U.S. Spending Momentum Index in June
Footnotes
- The analysis in the report was based on aggregated domestic spending data on the number of transactions at entertainment providers, retail goods merchants, specialty food and grocers, quick-service restaurants, full-service restaurants, bars and cafes. The lift is calculated by taking the volume of transactions that occurred during a 12-hour period before and after a match started and comparing it against a comparable typical day of the week and time of day for each country included in the analysis in late May and early June before the FIFA World Cup™ started.
Forward-Looking Statements
This report may contain forward-looking statements within the meaning of the U.S. Private Securities Litigation Reform Act of 1995. These statements are generally identified by words such as “outlook”, “forecast”, “projected”, “could”, “expects”, “will” and other similar expressions. Examples of such forward-looking statements include, but are not limited to, statements we make about Visa’s business, economic outlooks, population expansion and analyses. All statements other than statements of historical fact could be forward-looking statements, which speak only as of the date they are made, are not guarantees of future performance and are subject to certain risks, uncertainties and other factors, many of which are beyond our control and are difficult to predict. We describe risks and uncertainties that could cause actual results to differ materially from those expressed in, or implied by, any of these forward-looking statements in our filings with the SEC. Except as required by law, we do not intend to update or revise any forward-looking statements as a result of new information, future events or otherwise.
Disclaimers
The views, opinions, and/or estimates, as the case may be (“views”), expressed herein are those of the Visa Business and Economic Insights team and do not necessarily reflect those of Visa executive management or other Visa employees and affiliates. This presentation and content, including estimated economic forecasts, statistics, and indexes are intended for informational purposes only and should not be relied upon for operational, marketing, legal, technical, tax, financial or other advice and do not in any way reflect actual or forecasted Visa operational or financial performance. Visa neither makes any warranty or representation as to the completeness or accuracy of the views contained herein, nor assumes any liability or responsibility that may result from reliance on such views. These views are often based on current market conditions and are subject to change without notice.
Visa’s team of economists provide business and economic insights with up-to-date analysis on the latest trends in consumer spending and payments. Sign up today to receive their regular updates automatically via email.