Travel and cross border Asia Pacific travel takes a regional turn

November 2026 – Travel has faced no shortage of obstacles in 2026. Airspace disruption, higher fuel costs and the rerouting of flights following the Middle East conflict have made journeys more unpredictable and expensive. Yet travel to Asia Pacific has remained resilient. Beneath that resilience, however, important shifts are underway.
One of the clearest changes has been the growing importance of regional travel. According to estimates from the Visa International Travel platform (VISIT), Visa’s proprietary travel model, intra-Asia travelers now account for a larger share of arrivals to the region than before the conflict. Changes are afoot in not only where travelers are coming from, but also in where and why they are spending their money. We find Northeast Asia pulling away from the region’s traditionally popular beach destinations when it comes to winning travel spending, with wellness being one of the experiences that visitors are prioritizing even as travel budgets come under pressure.
Visa Business and Economic Insights (VBEI) studied where visitors to Asia Pacific are coming from, which destinations are attracting the most spending, and how travelers are choosing to spend once they arrive. Together, these trends provide a guide to the opportunities and risks shaping the region's tourism economy in the year ahead.
Geopolitical shocks are reshaping where travelers come from
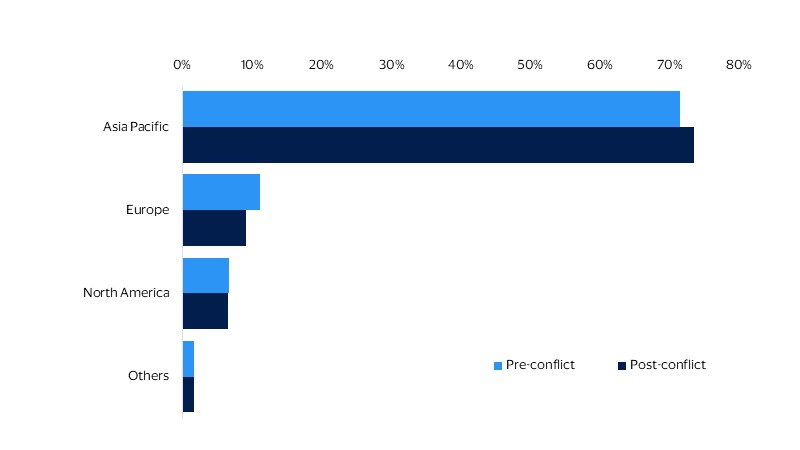
Share of inbound travelers to Asia Pacific by source market (%), Mar–Sept 2026 vs. Oct 2025–Feb 2026
Travel spending boom is coming from within the region
The share of Asia Pacific’s arrivals originating from within the region rose from 72 percent in the five months preceding the Middle East conflict to 74 percent in the seven months since. At the same time, the share of tourists from Europe and North America fell. Part of this shift reflects policy support, including expanded visa-free entry arrangements across markets, such as Mainland China.¹ However, higher airfares, longer flight routings and geopolitical uncertainty have also increased the appeal of regional travel.
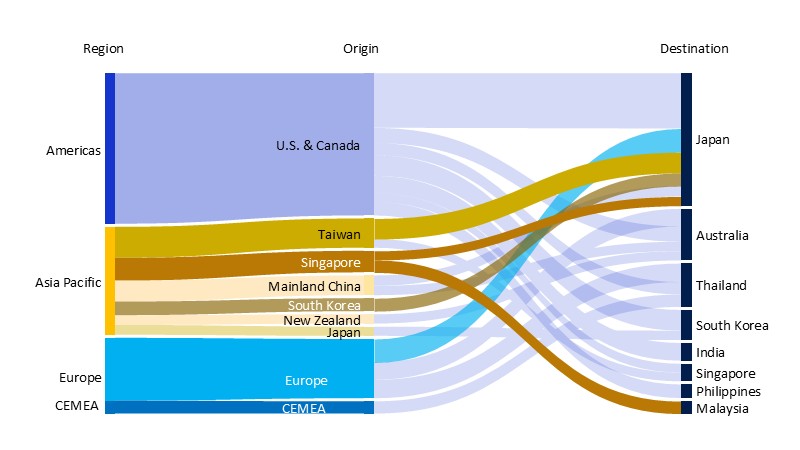
The rise in regional arrivals is increasingly being matched by spending. Our analysis of anonymized VisaNet transactions shows rapid growth in in-destination spending from regional tourists (see chart below). Travelers from Singapore, Taiwan and South Korea—three of the region’s semiconductor and AI investment hubs—are leading this spending growth. From February to July 2026, in-destination spend for the Singapore → Japan corridor nearly doubled in value compared to the same period last year, making it the fastest-growing inbound corridor, while the Taiwan → Japan corridor is not only one of the largest in the region by value, but also one of the fastest growing. In fact, four of the five fastest-growing corridors originate within Asia Pacific; the only exception is Europe → Japan. As household wealth continues to rise across Asia Pacific, supported by growth in AI investment and semiconductor manufacturing, we expect regional travelers to become an even more important source market for travel, hospitality and payments businesses.
Long-haul visitors drive value, while regional travelers drive growth
Top 20 inbound corridors by traveler spend, with the five fastest-growing highlighted, March–August 2026
South Korea, Japan and Singapore win more travel spend
Across Asia Pacific, a combination of affordability and cultural appeal is increasingly shaping where travelers choose to go and where they spend their money. Our analysis suggests that South Korea is attracting above-average spending growth from travelers across regions (see chart below). Its success reflects the global popularity of K-pop, K-dramas and K-beauty and its ability to transform its cultural exports into tourism demand. Its cultural influence is visible well beyond Asia, with above-trend spending growth across all regions.
The strongest-performing destinations are drawing spend from across regions
Spending growth by destination, indexed to each origin region’s overall spending growth across Asia Pacific, Mar–Sept 2026 vs. Oct 2025–Feb 2026
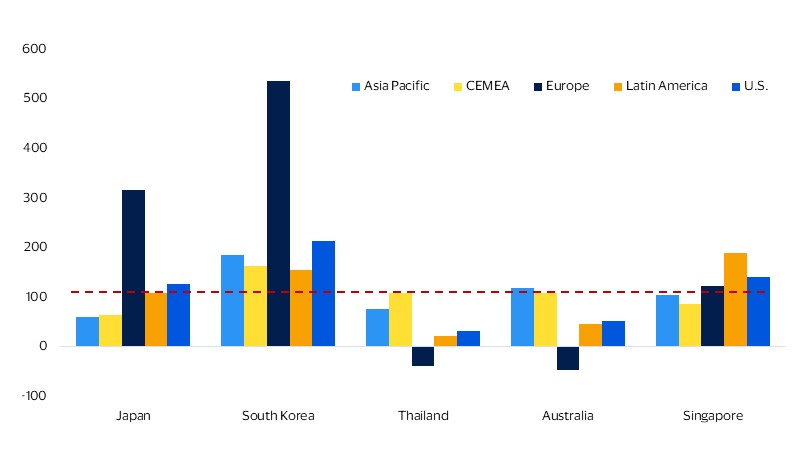
South Korea also shows how spending experiences can reinforce a city’s role as a tourism gateway. Much of the country's cultural, entertainment and wellness proposition is concentrated in its capital, Seoul, encouraging visitors to build itineraries around the city's neighborhoods, shops and experiences associated with Korean popular culture. Its popularity as a destination is evident in broader travel metrics as well. Seoul's Incheon International Airport handled more than 38 million international passengers in the first half of 2026, ahead of both London's Heathrow and Singapore's Changi airports.² Japan and Singapore trail South Korea in attracting above-average visitor spending, suggesting a preference for urban gateways.
Exchange rates also factor into how attractive a destination appears to travelers by shaping their perceptions of its affordability. Currencies in several Asian markets have been weakening against the U.S. dollar since 2020 (see chart below), with recent energy price shocks and diverging monetary policies adding further pressure to some. Japan, South Korea and Thailand, the three largest destinations by inbound spending on cards, have all become more affordable in U.S.-dollar terms, strengthening their appeal to both regional and long-haul travelers even as they make outbound travel from these markets less attractive.
Soft power meets softer currencies
U.S. dollar per local currency (2020=100)
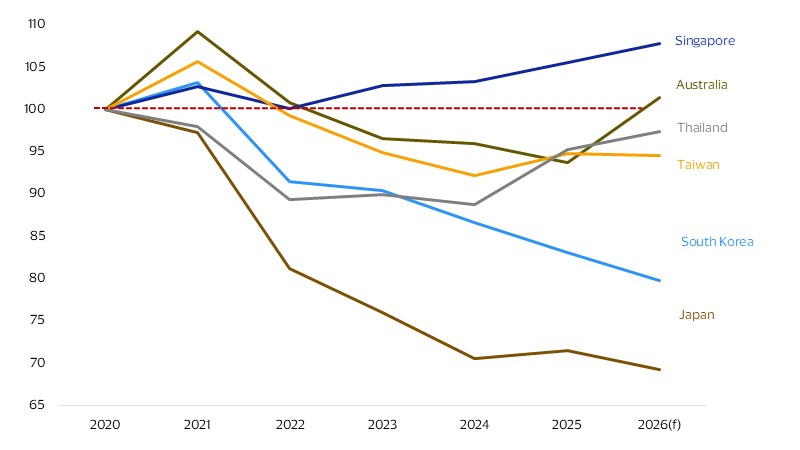
Japan—whose popularity as a destination has shot up since reopening from the pandemic on a mix of culture, cuisine, retail and entertainment attractions, as well as a weak currency—has also been attracting above-average spending from Europe and the U.S. Increasingly, however, growth is being driven by a broader mix of developing markets, especially within Asia as well as from Latin America, as travelers are drawn by this premium destination’s relative currency advantage. In fact, Latin American visitor spending growth was well above average in Japan, South Korea and Singapore.
For issuers, one implication to be mindful of is that travel decisions are now being made long before a holiday begins. As culture, entertainment and lifestyle experiences become more important drivers of tourism demand, opportunities to engage cardholders may increasingly appear earlier in the travel journey through partnerships, rewards and propositions aligned with these popular experiences.
The wellness exception
The same forces helping South Korea attract visitors are also influencing how they allocate their travel budgets once they arrive. The popularity of Korean pop culture has also exposed international consumers to Korean skincare, cosmetic treatments and wellness products long before they visit the country. For many visitors, spending on wellness is therefore not an incidental part of a trip, but a key motivation for travel itself. In fact, almost $1 in every $5 spent by international cardholders at South Korean merchants goes towards wellness-related services. In fact, average ticket size at health and wellness-related merchants is the highest among all other merchant categories—and more than 50 percent above that for airlines.
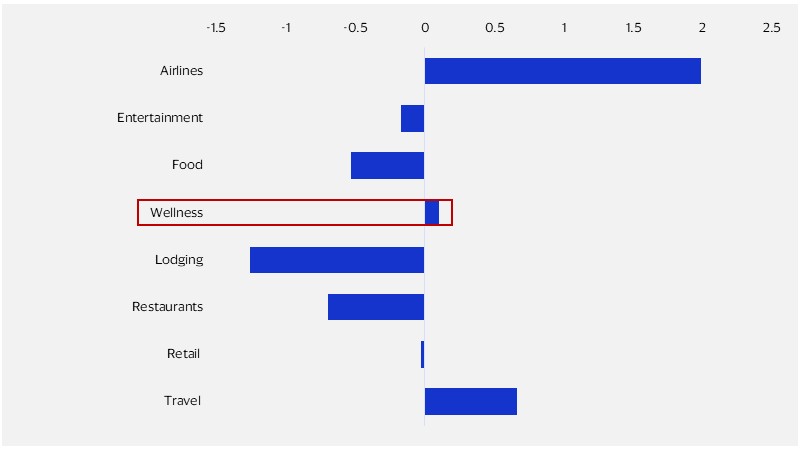
The trend, however, extends beyond South Korea. The chart below shows changes in the share of inbound tourist spending on different categories across a group of Asian markets. With spending at airlines rising because of higher fuel prices, tourists have had to scale back on popular categories like lodging and retail. Wellness spending, on the other hand, has increased despite cost-of-living pressures.
Looking ahead, this preference for wellness experiences is one of three key trends likely to drive tourism growth in the region, alongside cultural tourism and rising affluence among Asia Pacific consumers. The risks to this outlook, however, lie not in demand, but in disruption. Geopolitical tensions can swiftly redirect travel flows, while environmental shocks and extreme weather can alter itineraries and destination attractiveness. Haze from wildfires has already disrupted flights in parts of Southeast Asia,³ and further intensification of a strong El Niño raises the prospect of extreme heat or floods across the region. These events may create new winners and losers across Asia Pacific's tourism market, even as the region remains well positioned to capture a growing share of global travel demand and spend.
Travel costs pull ahead, but wellness spending survives
Change in share of spending by international tourists in select markets* (percentage points, March-August 2026)
* Mainland China, Japan, Thailand, South Korea, Vietnam and Taiwan.
Footnotes
- VisasNews, December 2025, China extends visa-free policy for France and other countries until December 31, 2026.
- BBC News, August 2026, South Korea's Incheon airport becomes world's busiest for global traffic.
- Channel NewsAsia, October 2026, Indonesia haze: Flights cancelled between Singapore and Palembang.
Forward-Looking Statements
This report may contain forward-looking statements within the meaning of the U.S. Private Securities Litigation Reform Act of 1995. These statements are generally identified by words such as “outlook”, “forecast”, “projected”, “could”, “expects”, “will” and other similar expressions. Examples of such forward-looking statements include, but are not limited to, statements we make about Visa’s business, economic outlooks, population expansion and analyses. All statements other than statements of historical fact could be forward-looking statements, which speak only as of the date they are made, are not guarantees of future performance and are subject to certain risks, uncertainties and other factors, many of which are beyond our control and are difficult to predict. We describe risks and uncertainties that could cause actual results to differ materially from those expressed in, or implied by, any of these forward-looking statements in our filings with the SEC. Except as required by law, we do not intend to update or revise any forward-looking statements as a result of new information, future events or otherwise.
Disclaimers
The views, opinions, and/or estimates, as the case may be (“views”), expressed herein are those of the Visa Business and Economic Insights team and do not necessarily reflect those of Visa executive management or other Visa employees and affiliates. This presentation and content, including estimated economic forecasts, statistics, and indexes are intended for informational purposes only and should not be relied upon for operational, marketing, legal, technical, tax, financial or other advice and do not in any way reflect actual or forecasted Visa operational or financial performance. Visa neither makes any warranty or representation as to the completeness or accuracy of the views contained herein, nor assumes any liability or responsibility that may result from reliance on such views. These views are often based on current market conditions and are subject to change without notice.
Visa’s team of economists provide business and economic insights with up-to-date analysis on the latest trends in consumer spending and payments. Sign up today to receive their regular updates automatically via email.