Affluent consumers set to drive global travel amid slowing world economy

July 2025 – What do destinations such as Hokkaido in Japan, Mendoza in Argentina and Mersa Matruh in Egypt have in common? While not among the destinations most visited by the affluent, they all have special appeal and could very well be among the top emerging destinations in the coming five years. Wealthy travelers since the time of Dickens and Goethe have long been the original influencers, and where they go often blazes new trails. As the travel industry faces affordability challenges and capacity constraints, affluent consumers could once again play an outsized role in shaping future travel trends.
Global affluent households, which in this report are those with incomes exceeding 200,000 USD per year, may be in the minority at only 5 percent of all households, but they punch well above their weight in terms of total spending. In fact, these global affluent consumers are estimated to account for as much as one of every four dollars spent last year.
Our research reveals some new insights into the profile of today’s affluent travelers and the global travel destinations they frequent. Utilizing VisaNet data and the Visa International Travel database from Visa Business and Economic Insights, we combined depersonalized, aggregated transaction data with international travel estimates to come up with a new way to assess the volume of affluent travelers to destinations (see tables below).¹
Our analysis indicates that travelers from emerging markets favor a more diverse set of locations across multiple regions. Based on these preferences, new hotspots for affluent travel could emerge as the influence of emerging market affluent travelers continues to grow.
London tops the list for affluent travelers, regardless of origin
Top 5 cities visited by affluent travelers
Coming from emerging markets
Coming from advanced markets
Affluent travelers are key and their preferences are evolving
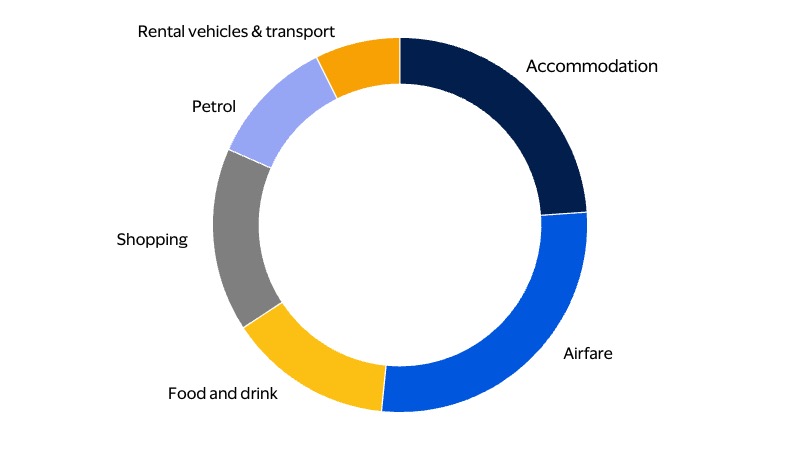
A growing body of data shows that a small, affluent cohort is responsible for a disproportionately large—and rising—share of global travel spending. The affluent have an outsized impact on both the composition and growth of spending globally. In the U.K. and U.S., the top-income decile spends at least twice the national average on restaurants and hotels.² In Australia, domestic luxury travelers, defined as those whose average spend exceeds 500 USD per night, devote a third of their budgets to food, drink (including wine), and shopping (see figure below).³
Affluent indulge in dining and shopping
Distribution of average spend per night by domestic luxury travelers in Australia
Even with growing economic uncertainty and market volatility, affluent travel demand is likely to remain resilient and could be a key driver of tourism growth. In the U.S., affluent individuals planning international travel in the next 12 months expect to spend 38 percent more on average than non-affluent travelers. Additionally, 56 percent plan to take a cruise abroad within six months. Meanwhile, for around two-thirds of these affluent travelers, airline and hotel loyalty programs dictate their preferred choice of flight and accommodation.⁴
The affluent’s desire—and capacity—to travel has remained remarkably strong, despite ebbs and flows in asset markets. Their outsized spending drives the entire travel ecosystem, including airlines, hotels, dining and retail sales in destinations worldwide.
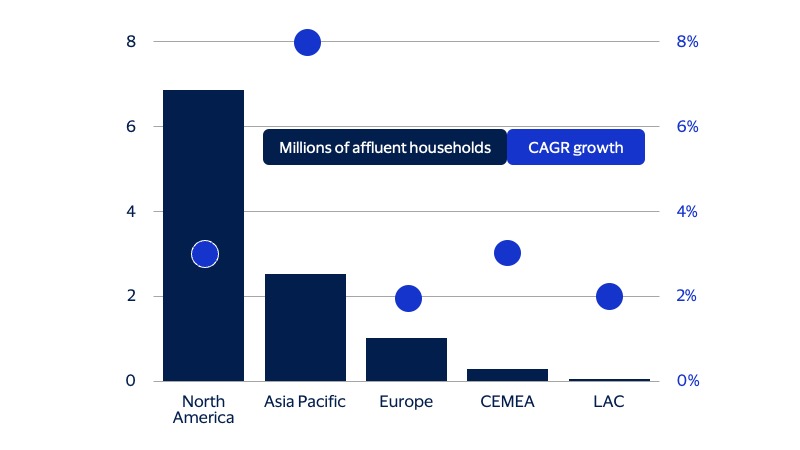
The affluent’s outsized spending is no longer concentrated solely in the West. It is increasingly dispersed across a widening band of emerging markets—reshaping not just how much is spent on travel, but also where that spending will originate and flow. A decade ago, the affluent traveler was still largely a North American or Western European. Today the map is being redrawn by the rapid rise of upper-income households in China, India, Indonesia, Brazil and other high-growth economies. Since 2010, the share of global affluent households in North America and Europe has slipped by roughly 2 percentage points. Over the same period, Asia Pacific’s share has expanded to about 10 percent and is projected to reach 12 percent by 2030 (see figure below). In the next five years, the number of affluent households in Asia Pacific is expected to increase at an 8 percent compound annual growth rate (CAGR)—the fastest pace of any region.
The geography of new affluent is shifting
New affluent households expected to be added 2025-2030
Affluent travelers are reshaping global tourism
Affluent travelers demonstrate a growing appetite for both long-haul luxury experiences and regional escapes that offer convenience and cultural familiarity. In MENA, better air connectivity, easier visas, and short trip appeal are driving intra-regional travel. Affluent cardholders dominate cross-border travel within the MENA region, accounting for 55 percent, the highest among regional corridors. Meanwhile, extra-regional journeys remain a hallmark of affluent lifestyles. The MENA-Europe corridor is the top extra-regional corridor, with affluent cardholders accounting for 65 percent of the corridor’s cross-border travel in 2024, based on VisaNet data.
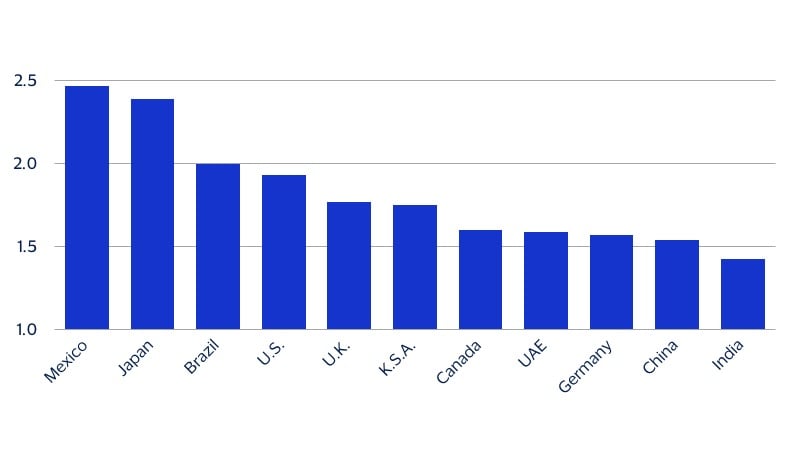
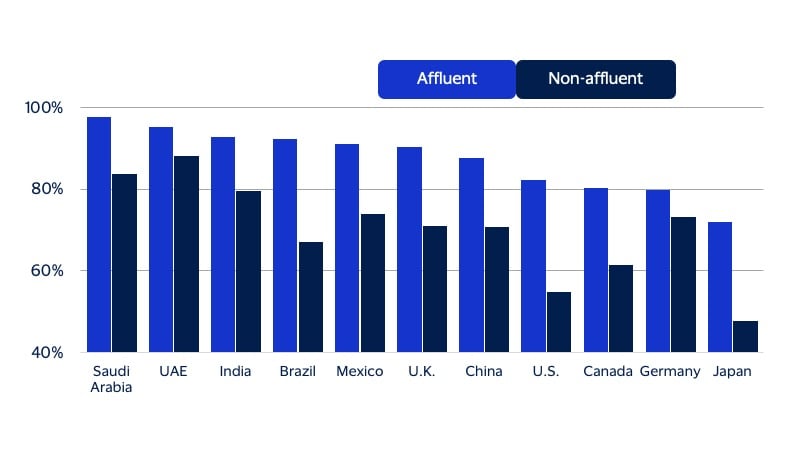
Despite all the uncertainty around trade and the global economy, a majority of affluent consumers are still planning to travel at least once over the next 12 months, according to YouGov survey data (see figure below).
Global affluent consumers travel nearly twice as frequently as the non-affluent
Ratio of average planned trips per affluent traveler to non-affluent over the next 12 months
Globally, affluent travelers are increasingly favoring Asian destinations, rather than the traditional Western locales at the margin. For instance, Japan has experienced an increase in visits from wealthy travelers, particularly those from the U.S., Australia, and the UAE. By 2024, it became the 7th most visited country by affluent travelers from U.S., up from 9th the preceding year, showcasing its appeal as a high-end destination with rich culture and modern luxury. Wealthy travelers look for immersive, authentic experiences, and Japan's mix of tradition and innovation caters to this preference seamlessly. The country's focus on service and attention to detail appeals to high-net-worth individuals seeking quality and sophistication.
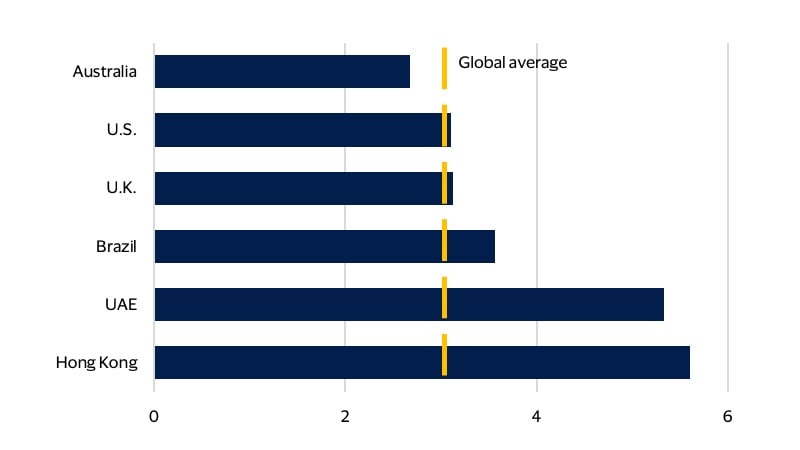
Affluent travelers' cross-border credit spend at destination was three times that of non-affluent travelers in 2024, based on the global average (see figure below). In particular, the ratio was six times in Hong Kong, with retail accounting for more than half of affluent credit spend. Across other sampled countries—UAE, Brazil, U.K., U.S., and Australia—retail consistently represented a significant portion of affluent spend, ranging from 31 percent to 46 percent. This underscores affluent travelers’ strong preference for retail experiences while abroad, particularly in markets with well-developed luxury and lifestyle offerings. All considered, the data suggests that affluent travelers not only spend more overall, they also concentrate a significant share of their expenditures in retail. Accordingly, retail remains a key segment for merchants and issuers targeting cross-border commerce.
Affluent travelers' cross-border credit spend is three times greater than non-affluent
Cross-border credit spend at destination, ratio of spend by affluent vs. non-affluent in 2024
Emerging market affluent consumers represent a growing opportunity
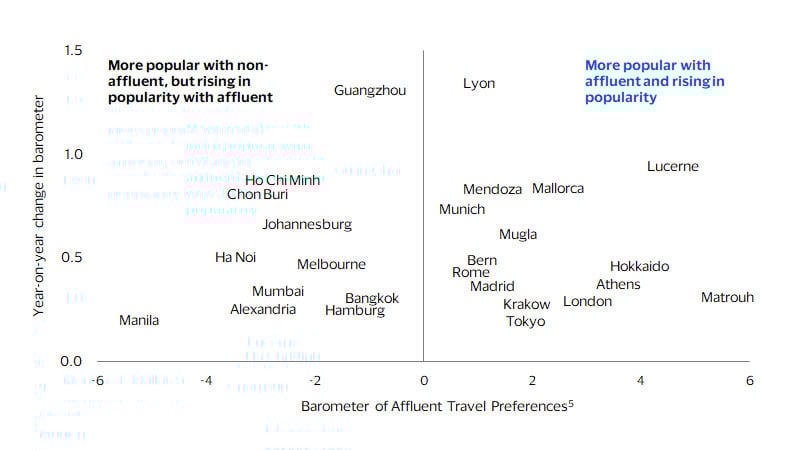
For the emerging market affluent, travel is now a lifestyle, not a luxury, with a significant share of the affluent planning trips over the next 12 months (see figure below). They are increasingly seeking travel “off the beaten path”—beyond the major world capitals. In fact, those major cities are becoming less popular due to crowded tourist spots and lengthy visa processes for short stays, including for visitors from major emerging markets.
Travel appeals highly to affluent consumers, especially in emerging markets
(Percent of affluent respondents planning at least one trip within the next 12 months)
Emerging market affluent travelers are increasingly favoring emerging economies
Destination country preferences of emerging market affluent travelers (sample)⁵
Footnotes
- VBEI analysis of visitor arrivals to destinations based on the levels of affluence derived from data from VisaNet and Visa International Travel Platform. Visitors from these origin countries were included in the analysis: Argentina, Australia, Brazil, Canada, Colombia, Egypt, France, Germany, Hong Kong, India, Indonesia, Italy, Japan, Mexico, Malaysia, Peru, Poland, Saudi Arabia, South Africa, Sweden, Switzerland, United Arab Emirates, United Kingdom, United States, Vietnam.
- VBEI analysis of U.K. Family Spending Survey data (Office of National Statistics) and U.S. Consumer Expenditure Survey (Bureau of Labor Statistics). Latest available data is as of 2023.
- Tourism Research Australia. Domestic visitor profiles: Luxury travel. Latest available luxury statistic is as of 2019.
- VBEI analysis of the VBEI U.S. Quarterly Consumer Survey, July 2025.
- Top preferred destinations for affluent travelers are determined by the barometer of affluent travel preferences. This barometer shows the difference in travel share between affluent and non-affluent travelers to a destination (in percentage points), utilizing depersonalized and aggregated VisaNet data.
Forward-Looking Statements
This report may contain forward-looking statements within the meaning of the U.S. Private Securities Litigation Reform Act of 1995. These statements are generally identified by words such as “outlook”, “forecast”, “projected”, “could”, “expects”, “will” and other similar expressions. Examples of such forward-looking statements include, but are not limited to, statements we make about Visa’s business, economic outlooks, population expansion and analyses. All statements other than statements of historical fact could be forward-looking statements, which speak only as of the date they are made, are not guarantees of future performance and are subject to certain risks, uncertainties and other factors, many of which are beyond our control and are difficult to predict. We describe risks and uncertainties that could cause actual results to differ materially from those expressed in, or implied by, any of these forward-looking statements in our filings with the SEC. Except as required by law, we do not intend to update or revise any forward-looking statements as a result of new information, future events or otherwise.
Disclaimers
The views, opinions, and/or estimates, as the case may be (“views”), expressed herein are those of the Visa Business and Economic Insights team and do not necessarily reflect those of Visa executive management or other Visa employees and affiliates. This presentation and content, including estimated economic forecasts, statistics, and indexes are intended for informational purposes only and should not be relied upon for operational, marketing, legal, technical, tax, financial or other advice and do not in any way reflect actual or forecasted Visa operational or financial performance. Visa neither makes any warranty or representation as to the completeness or accuracy of the views contained herein, nor assumes any liability or responsibility that may result from reliance on such views. These views are often based on current market conditions and are subject to change without notice.
Visa’s team of economists provide business and economic insights with up-to-date analysis on the latest trends in consumer spending and payments. Sign up today to receive their regular updates automatically via email.