Economic outlook and forecasts A far-from-average year ahead

Pace of global economic growth has flattened out over the past decade
(Global GDP at fixed market exchange rates and constant prices, year-on-year)
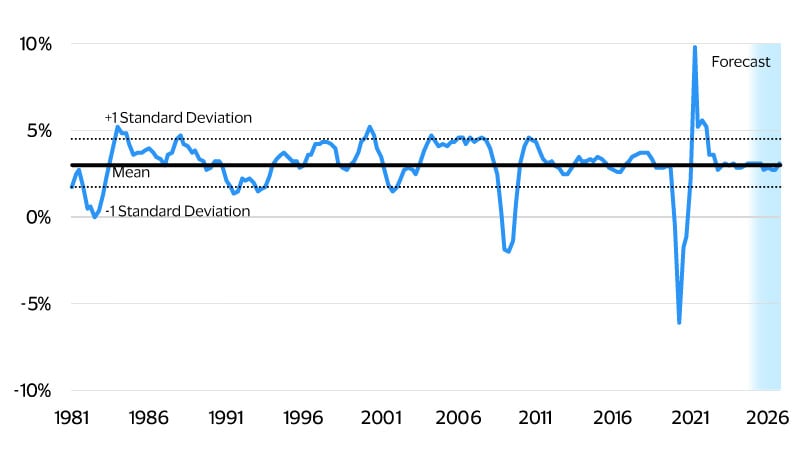
What is of note is the rewiring of the global economy underneath that seemingly calm expansion. Geonomics is displacing globalization. Generative AI is supercharging the digitalization of business and the economy. Population aging is exerting greater downward pressure on growth, especially now that migration has stalled or in some cases gone into reverse. Keeping on top of these changes can make a great year out of an average one. It can also help to avoid large losses. As recent experience has shown, small changes in seemingly remote areas such as a novel virus or troubles in structured mortgage finance can induce changes far beyond what is normal.
Timely data and insights are key to outperforming the average and avoiding potential pitfalls. Equally important is building in the agility to adapt to changing circumstances, whether in key supply relationships or in payment options. This flexibility can prove vital in these seemingly steady but ever-changing days.
Steady consumer spending anchors the outlook
Despite policy upheavals and uncertainty, the global economy remained stable in 2025 as businesses and consumers adjusted to the changes. Businesses front-loaded their exports to the United States ahead of trade policy changes, later passing costs gradually to consumers. A swift recovery in financial markets, driven by AI enthusiasm, added buoyancy to consumer spending. Real consumer spending as a result is expected to increase 2.7 percent in 2025 and ease to 2.4 percent in 2026. Since spending accounts for over half of real GDP, its stability provides the ballast to keep the global economy steady over turbulent waters.
The Visa Spending Momentum Index (SMI) measures the breadth of consumer spending. For most of 2025, the global SMI¹ for both discretionary and non-discretionary spending ranged between 97 to 103, signaling a steady state in momentum. February was the only dip beyond that range due to leap-year effects. Of note, momentum in the two categories of spending has converged and returned to the closeness seen prior to the pandemic (see figure below).
Stable demand for luxuries and necessities
(Global SMI, not seasonally adjusted; **≥100 = expansion, <100 = contraction.)
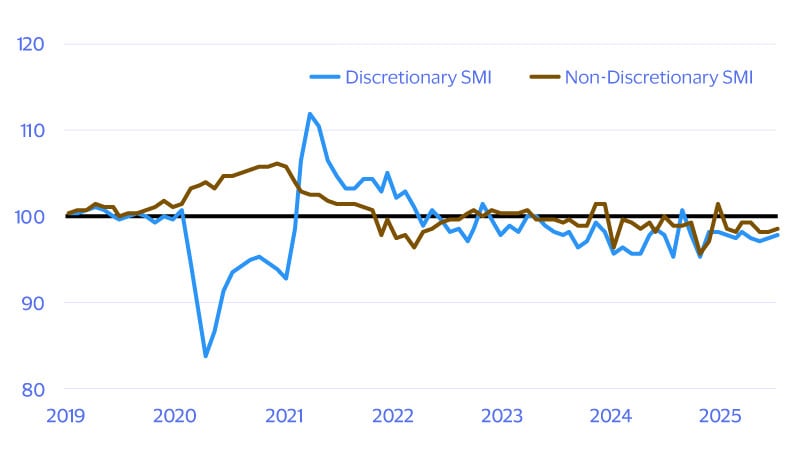
Double-clicking on the discretionary SMI, which tends to be twice as volatile as its non-discretionary SMI, reveals key insights for the 2026 outlook. Emerging market consumer spending has lost momentum through 2025. The discretionary SMI, being more sensitive to household income and employment shifts, likely reflects the impact of higher interest rates on consumers in major emerging markets like Brazil. While spending momentum in the U.S. and other advanced economies is subdued and steady, that resilience stands to be tested in 2026.*
Weaker momentum in discretionary spending in emerging markets could also reflect falling consumer prices.* Global inflation is estimated at 3.4 percent in 2025, easing to 3.1 percent in 2026. Price pressures in most of the world are likely to remain weak over this period as falling Chinese goods prices impact the rest of the world. First, as Chinese exports are redirected from the U.S. to other markets, this increases consumer goods supplies relative to demand, leading to lower prices. Second, lower export prices from China can suppress producer prices in other countries. This means that barring significant policy shifts, China will likely continue exporting away that excess capacity, exerting downward pressure on global goods prices.
In contrast to other advanced economies and emerging markets, consumer price inflation in the U.S. has remained elevated. With producer prices falling faster in markets outside of United States, non-U.S. consumers should see further benefits in 2026 from lower prices for consumer goods.
Shifting forces reshape global commerce
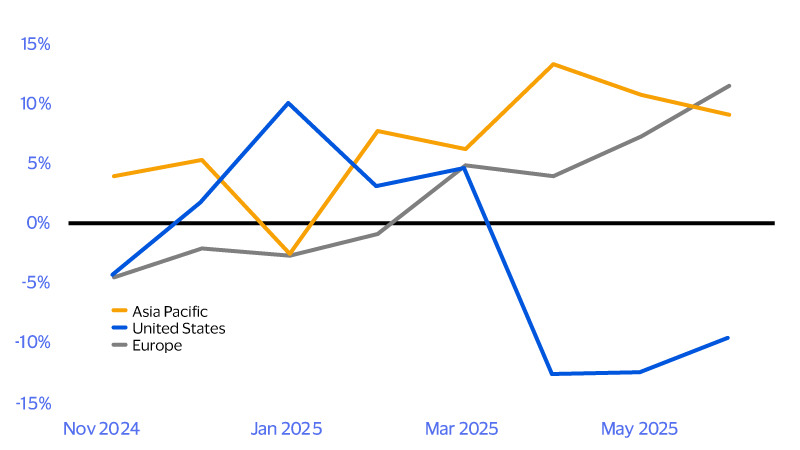
Supply chains are shortening, with intra-regional trade driving two-thirds of global growth
Intra-region imports year-on-year growth
We expect AI to deliver a modest global productivity uplift next year, roughly at the lower half of IMF’s 0.1-0.8 percentage-point per year estimate. Productivity dividends could be limited as was the case in past innovations where the lag from capex to measurable gains was substantial. Labor productivity growth estimates range widely for the major economies in 2026, ranging from 0.5 percent in both the Eurozone and U.K., 1.5 percent in Japan and 2.4 percent in the U.S. But total factor productivity—the efficiency and efficacy of an economy in harnessing all labor, machines and materials to produce goods and services—remained largely flat across these economies.
Further, for years, global potential growth has been held back by aging populations and a shrinking workforce. While AI hasn’t yet delivered a productivity miracle, it’s changing how companies address labor shortages. Instead of hiring waves of new employees, firms are leveraging AI to automate tasks and scale knowledge work. This means the next phase of growth could be “near-jobless”—more output, but not necessarily significantly more jobs. Already, firms are leveraging AI to address the secular slowdown in labor supply, which was momentarily addressed over 2023–2024 with rapid immigration growth but ended with recent policy shifts in developed economies.
That said, AI can’t fully offset demographic headwinds. Countries like Japan have used robotics and automation to ease the burden of aging, but these are partial fixes. AI exposure varies widely across occupations: Roles such as programmers and administrative assistants are highly automatable, while others like salespeople are not. In addition, AI won’t fill gaps in sectors that rely heavily on immigrant labor. In fact, AI exposure tends to cluster in jobs with fewer foreign-born workers, meaning it won’t fill gaps in sectors heavily reliant on immigrant labor, based on recent empirical research.²
GenAI accelerates economic digitalization
Businesses are leading in the adoption rate
Credit cards subscribed to GenAI services (percent active, 12-month average)
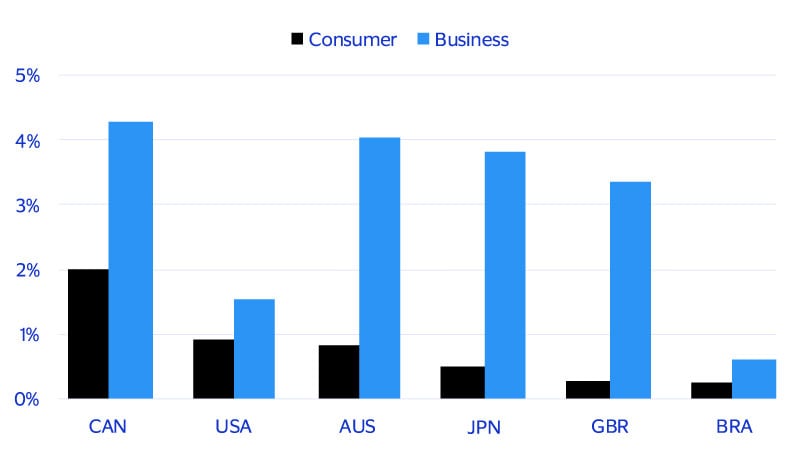
Even more notable, small businesses are now outpacing consumers in embracing these tools. This shift could redefine what “small” means: firms with lean headcounts but revenues rivaling today’s corporate giants. Early adopters aren’t just experimenting; they’re outperforming. Spending and transaction growth among businesses integrating AI far exceeds that of peers who haven’t made the leap, underscoring the potential for high returns on investment. And here’s a twist that may surprise U.S. investors: The next profitable AI-driven business model may not originate in Silicon Valley, but from markets abroad, where adoption is higher. The message for businesses and policymakers is clear: The time to craft a strategy for this rapidly expanding segment is now.
A more data-driven future augmented with the power of generative AI could further entrench patterns we have seen over the first quarter of this century. Digital technologies can help to improve marketing efficiency, boost consumer satisfaction by saving time and better manage inventories. As a result, the ups and downs of the business cycle can be flattened and compressed. But at the same time, these technologies also can widen the gains for those more actively engaged in adopting and adapting to the technologies, leading to widening inequalities. These same forces can also, in the face of exogenous shocks, magnify disturbances in the economy, leading to sharp shifts in the economic cycle. This is why we turn next to consider some alternatives to our baseline projection.
AI boom or bust: Risks behind the rally
The current strength of economic activity, particularly private investment, is heavily concentrated in building data centers and scaling AI infrastructure, which raises questions about what happens if the expected returns fail to materialize and a pullback from the sector emerges. Already, rising debt issuance and falling cash-to-asset ratios of tech firms signal emerging risks.
Moreover, equity valuations, as measured by the Shiller Cyclically Adjusted Price to Earnings Ratio, are at historic highs, and elevated compared to other productivity booms, such the electricity boom of the 1920s and the PC boom in the late 1990s. This signals that the market is currently potentially priced for perfection, leaving little room for further significant upside. Accordingly, stretched valuations make another equity boom unlikely, leaving consumption volatile and vulnerable to asset shocks and longer-term growth dependent on a sustained rebound in real incomes.
If the downside scenario of an AI bust plays out, companies may be forced into deeper investment, production cuts and even layoffs just to stay financially afloat. The weaker job prospects will weigh on household spending and sentiment, deepening the slowdown. This weakness spills over globally with tech exporters particularly hard hit. Financial conditions are likely to tighten abruptly as risk aversion spikes; real economic activity could slow down sharply. All considered, global GDP growth could slump to 1.8 percent in 2026, about 0.9 percentage points below the baseline. Meanwhile, real global consumer spending growth could reach 1.9 percent, 0.5 percentage points below the baseline.*
On the upside, the global economy could continue to ride high on robust U.S. tech investment and soaring stock prices. Rapid AI adoption is driving productivity forward, and U.S. tech capital spending continues to surge, echoing the boom of the 1990s. As U.S. growth spills over to the rest of the world, especially to countries exporting tech-related products, the global economy strengthens. Global GDP growth is expected to reach 3.1 percent in 2026, about 0.4 percentage points above the baseline. That said, the expansion will still be near-jobless. But in this instance, wages will rise in line with productivity gains, and alongside rising wealth support consumer spending. Real global consumer spending in the upside scenario is expected to rise by 2.6 percent in 2026, 0.2 percentage points above the baseline.
*View these charts in the full PDF report.
Footnotes
- Regional and global aggregates are nominal private consumption-weighted averages. Source: Visa Business and Economic Insights. **The Visa SMI measures the current quarter relative to the same quarter last year. Readings of the index are based on year-on-year changes in consumer spending with Visa bankcards.
- AI and demographic changes | The Budget Lab at Yale
Forward-Looking Statements
This report may contain forward-looking statements within the meaning of the U.S. Private Securities Litigation Reform Act of 1995. These statements are generally identified by words such as “outlook”, “forecast”, “projected”, “could”, “expects”, “will” and other similar expressions. Examples of such forward-looking statements include, but are not limited to, statements we make about Visa’s business, economic outlooks, population expansion and analyses. All statements other than statements of historical fact could be forward-looking statements, which speak only as of the date they are made, are not guarantees of future performance and are subject to certain risks, uncertainties and other factors, many of which are beyond our control and are difficult to predict. We describe risks and uncertainties that could cause actual results to differ materially from those expressed in, or implied by, any of these forward-looking statements in our filings with the SEC. Except as required by law, we do not intend to update or revise any forward-looking statements as a result of new information, future events or otherwise.
Disclaimers
The views, opinions, and/or estimates, as the case may be (“views”), expressed herein are those of the Visa Business and Economic Insights team and do not necessarily reflect those of Visa executive management or other Visa employees and affiliates. This presentation and content, including estimated economic forecasts, statistics, and indexes are intended for informational purposes only and should not be relied upon for operational, marketing, legal, technical, tax, financial or other advice and do not in any way reflect actual or forecasted Visa operational or financial performance. Visa neither makes any warranty or representation as to the completeness or accuracy of the views contained herein, nor assumes any liability or responsibility that may result from reliance on such views. These views are often based on current market conditions and are subject to change without notice.
Visa’s team of economists provide business and economic insights with up-to-date analysis on the latest trends in consumer spending and payments. Sign up today to receive their regular updates automatically via email.