U.S. Economic outlook and forecasts A year of divergence: 5 forces shaping 2026

December 2025 – As we prepare to turn the page on this year, we expect 2026 to be characterized by divergence across several key economic trends. Demographic headwinds that once seemed years away have accelerated, exerting an outsized influence on everything from the labor market to consumer spending and even inflation. Slower labor force growth, and therefore slower job growth, will create a challenging dichotomy: persistently firm inflation pressures alongside soft employment gains. This divergence within the Federal Reserve’s dual mandate will make the delicate balancing act of keeping inflation in check while supporting the labor market even more challenging.
In response, many companies may look for ways to do more with fewer workers, driving continued investment in artificial intelligence. The true potential of AI lies in its ability to unlock productivity gains at scale. In our view, these dynamics will be the key factors that influence growth in the year and possibly the decade ahead. While we expect economic growth to remain stable next year, it will likely mask underlying divergence in several areas.
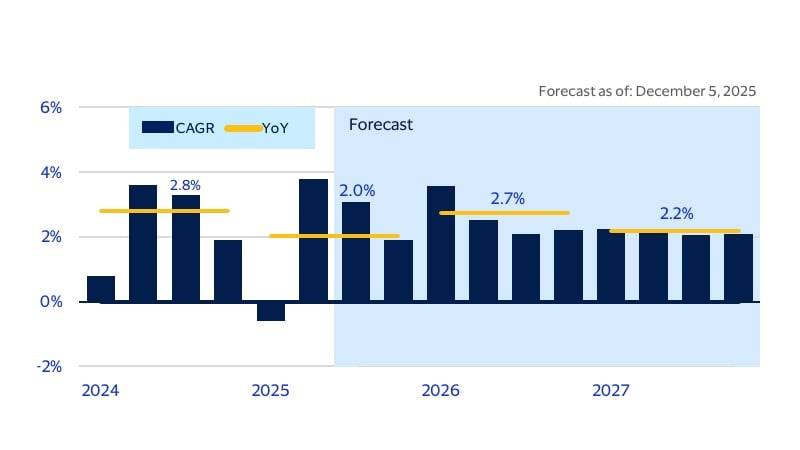
Economic growth in 2026 is expected to accelerate above this year’s pace of growth. While core demand this year remained strong, swings in trade and the pace of inventory building weighed on GDP growth. Next year, we expect less volatility from trade and inventories as more bilateral trade deals are established. GDP growth is expected to rise 2.7 percent year-over-year (YoY) in 2026, up from an estimated 2.0 percent this year (see figure below). Peeling away the tariff noise, core demand, as measured by core GDP growth,* is expected to remain steady next year at 2.5 percent.
Real gross domestic product (GDP)
(SA, CAGR and YoY** percent change)
Demographic headwinds: The golden years are here
Boomer retirement and slow immigration results in a smaller labor force.
Our 2022 report, “The Golden Years: Planning for the changing face of the U.S.,” highlighted the demographic challenges looming for the nation and their implications for economic growth. We cautioned that the potential for the economy to expand would be constrained, in part, by the size of our labor force. Looking ahead to 2026, we project job growth to average fewer than 100,000 jobs per month through the end of 2027. However, this pessimism for job growth does not translate into slower economic growth in our view. We expect a divergence between the pace of job growth slowing and somewhat faster consumer spending growth next year.
The current demographic trends of an aging population, coupled with slower population growth, have profound economic implications. As the baby boomer generation retires — currently at a rate of 11,400 per day — downward pressure is mounting on the supply of available labor.¹ A post-pandemic surge in immigration offset the impact of retirements and supported a robust labor market growth. During this period, the foreign-born share of the labor force was a crucial support for both labor market expansion and contributed to robust job growth. However, recent policies enacted to curb immigration have led to a downshift in foreign-born workers entering the U.S., and by extension, a downshift in the workforce. According to the Pew Research Center, the foreign-born share of the population peaked in January and has been steadily declining.² Since then, the labor force has grown more slowly, and job growth has moderated.
What does this mean for the labor market? Incorporating the latest revisions, monthly job growth since the start of this year has averaged just 76,000, down sharply from last year’s 168,000. Some analysts have sounded the alarm about a potential economic slowdown, citing soft employment prints and downward revisions. Our perspective differs. While job gains have slowed, so too has labor force growth. The unemployment rate, defined as the unemployed as a share of the labor force, can remain stable even with slower hiring, so long as the labor force itself grows more slowly.
As a result of slower labor force growth, the breakeven employment rate, a useful concept for understanding the pace of job growth needed to keep the unemployment rate stable, is now much lower than previous estimates. Using refreshed labor force growth projections from the Congressional Budget Office, we estimate breakeven job growth will be around 40,000 per month in 2026 and just 17,000 in 2027, assuming stable participation rates.³ Recent data supports this outlook as job gains have averaged just 62,000 per month over the last three months, yet the unemployment rate has remained relatively stable.
The breakeven rate is just an estimate, and monthly employment growth may fluctuate above or below it. But this concept is important for understanding the outlook for the labor market next year. Historically, slower job growth signaled economic weakness. Today, it reflects slower labor force growth, not necessarily a weakening economy. Our forecast calls for job gains to average 66,000 per month in 2026. Even with this slower pace, we expect the economy to continue growing, with only a slight rise in unemployment. Wage growth remains resilient, helping to offset slower employment gains. When we break down a proxy for income growth from the monthly employment report, wage gains have mostly offset the adverse effects of slower employment growth.* As a result, we expect consumer spending — and by extension, economic growth — to continue, albeit at a more modest pace than when labor force and job gains were stronger. The future we anticipated for 2030 in our 2022 report has arrived and is expected to influence the labor market in 2026. In short, America’s golden years are now upon us.
Disposable income divide to influence consumer spending
Tax policy changes to play a role in consumer spending early next year.
Next year, fiscal policy is poised to influence the consumer side of the economy. Upcoming tax policy shifts are set to push disposable income growth higher next year, and as a result boost consumer spending growth. However, these changes are also likely to drive a divergence in both income and spending across income tiers in 2026.
Reforms to the tax code slated for 2026 are expected to reshape take-home pay and, by extension, household spending. The higher cap on the State and Local Tax (SALT) deduction will particularly benefit eligible consumers in high-tax states. Since there is a high concentration of both high tax states in the Northeast region of the U.S., we expect the SALT deduction will likely have the most pronounced impact on the Northeast region.⁴ As a result, we expect this region to lead the nation in consumer spending growth through the first half of 2026.
Additional changes, such as the removal of federal income tax on tips, will directly boost take-home pay for workers in the service and hospitality sectors. This influx of disposable income will likely translate into increased spending for everyday purchases, leisure activities and even savings products. Similarly, untaxed overtime wages will reward hourly workers, incentivizing more work hours and resulting in greater disposable income for working families.
While changes in tax policy are likely to benefit consumers across the income spectrum, we expect that the benefits will disproportionately accrue to higher income households. Inflation-adjusted income growth for those in the top 25 percent of income earning households has diverged significantly from the rest of consumers, particularly those in the bottom 25 percent of income earning households (see figure below). We expect that this divergence is likely to widen next year, with implications for consumer spending.
Income divergence has widened
Real income growth by quartile (NSA, YoY percent change)
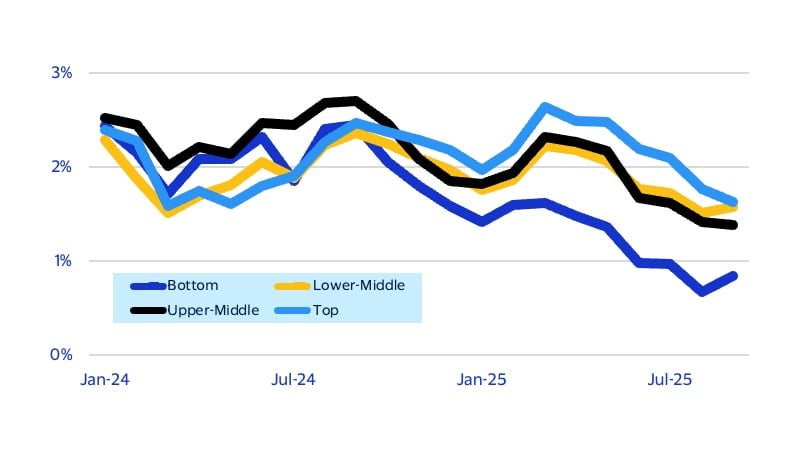
For some higher income consumers, the increased SALT deduction will yield a substantial boost in tax refunds early next year. This influx of resources is expected to lead to a pronounced expansion in discretionary spending such as travel, luxury goods, fine dining as well as advanced wellness and health services. Thus, the spending boost we expect to occur in the first six months of 2026 will be largely driven by higher income consumers in high tax states boosting their spending in big ticket categories.
In contrast, lower income consumers will experience more modest increases in after-tax income. For these consumers, any gains from untaxed overtime or the removal of federal income tax on tips will be vital in supporting basic spending needs rather than discretionary items. Most of their additional income is expected to be allocated toward essential categories, including groceries, utilities, rent or mortgage payments, transportation and out-of-pocket healthcare expenses. While some lower- and middle-income households may use a portion of their increased take-home pay for home improvements, affordable leisure activities or to bolster emergency savings, their capacity for large-scale or aspirational purchases will remain limited. As a result, spending behavior in these segments will continue to be shaped by a focus on budgeting and value seeking.
Inflation reaches a crossroads
Inflation is poised to ease in 2026, but the story is far from uniform.
While inflation remains elevated, diverging factors are expected to influence the inflation outlook in 2026. One of the clearest signs of progress toward lower inflation comes from labor-intensive services, where inflation pressures have softened considerably, especially when viewed through the lens of market-based personal consumption expenditures (PCE). This measure strips out imputations and non-market pricing. This cleaner signal shows that labor services inflation — long the stubborn core of the problem — is well below the Federal Reserve’s 2 percent target. Labor services inflation increased 1.3 percent YoY in September, a far cry from an average of 1.6 percent in 2024 and 2.1 percent in 2023.*
The cooling labor market has contributed to this shift. While retiring baby boomers and slower immigration will pose headwinds for job growth, these structural changes will keep income growth anchored. However, these icy labor market dynamics won’t foster the same level of dynamism — or acceleration in wage growth — seen over the past several years. We see the net result as labor services inflation that remains sticky yet stable, neither significantly accelerating nor downshifting.
The picture beyond services is more complicated. Core goods inflation, which had previously been a source of relief, now faces renewed upward pressure. Tariffs have added friction to supply chains, raising import costs and nudging prices higher. In the report, figure 4 shows that core goods are now adding to inflation, after acting as a source of disinflationary pressure for much of the past year.*
Energy prices also tell a nuanced story. Lower oil prices should deliver headline relief, easing gasoline costs for households. But this benefit will be partially offset by rising electricity and natural gas prices, driven in part by AI-related infrastructure investment. Net energy inflation will likely continue downshifting, though not as sharply as oil price trends alone might suggest.
Food inflation has also re-emerged as a concern, with weather-related crop issues, livestock shortages and higher input costs driving recent growth. The Consumer Price Index for food increased 3.1 percent YoY in September, a sharp jump from 2.5 percent growth at the beginning of the year.
We expect housing inflation to continue to slowly ease. Elevated mortgage rates are keeping home sales depressed and rental costs are subsiding after a deluge of newly built multifamily housing hit the market over the past year. However, price adjustments take time to show up in the data, and we expect housing to remain a sizable contributor to inflation well into 2026.
Our forecast calls for headline and core inflation, as measured by the PCE deflator, to average YoY growth of 2.3 and 2.4 percent in Q4-2026, respectively.* Upside risks remain, particularly from stronger tariff pass-through effects. We suspect that the bulk of the tariff impact to prices is now behind us but there is a risk that tariffs could lift inflation expectations. On the downside, a deeper labor market slowdown and weaker income growth could push down labor services inflation. We see the balance of risks to inflation next year as two-sided.
The Fed’s balancing act gets tougher
Interest rates are expected to ease in 2026, but the road won’t be smooth.
The Federal Reserve’s dual mandate — maximum employment and price stability — remains at the center of policy decisions. In recent years, the Fed prioritized bringing down inflation through higher interest rates, but the slower pace of job growth is now complicating the picture.
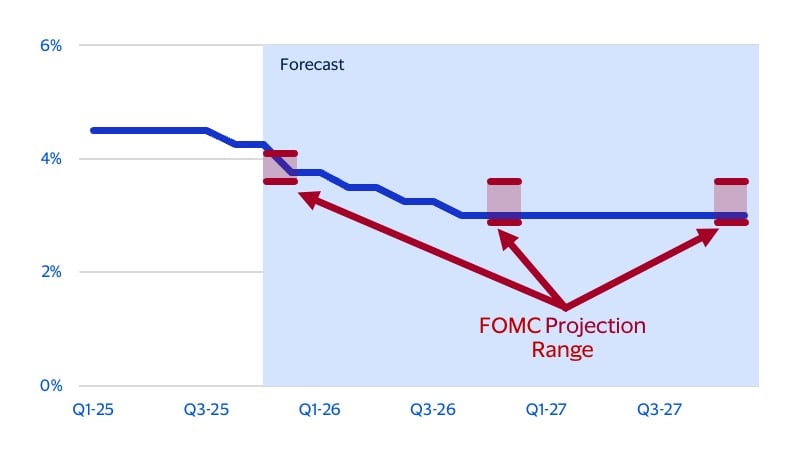
In 2026, the Fed faces a difficult balancing act navigating divergent trends in its dual mandate. Inflation is expected to stay above their 2 percent target while job growth remains weak. The challenge will be easing policy enough to support job growth without reigniting inflation. Recent speeches and Fed meeting minutes suggest policymakers are leaning toward supporting the labor market. As a result, we anticipate three 25 bps cuts in 2026 reaching an upper bound of 3 percent by the end of the year in 2026 (see figure below). The Fed funds rate is likely to stay above pre-pandemic levels throughout the expansion, driven by sticky inflation that remains above target.
Federal funds rate forecast
(percent)
The Fed has also ended its policy of allowing maturing assets to roll off its balance sheet, which was effectively tightening financial conditions. While the Fed primarily influences short-term rates, financial operations, such as controlling the run-off of assets off its balance sheet, have a more direct impact on long-term rates. Holding their balance sheet stable should support greater liquidity in the financial system and help stimulate credit demand, though the impact will be uneven across sectors. Industries such as banking, consumer credit and corporate borrowers with floating rate debt tend to be sensitive to short-term rates and are therefore more likely to experience a boost next year.
Importantly, the Fed plans to adjust its portfolio toward a greater share of U.S. Treasuries. As a result, mortgage rates should begin to slowly come down next year.
We also anticipate a steeper yield curve in 2026, as short-term rates fall more sharply than long-term rates. While a steeper yield curve supports broader credit access, certain sectors are likely to benefit more than others. Lower short-term rates will reduce borrowing costs for businesses, encouraging investment and potentially supporting broader economic activity. However, persistently elevated long-term rates are likely to limit mortgage affordability for homebuyers, raise discount rates for asset valuations and constrain capital-intensive projects.
Even as the Fed moves toward more normal policy, long-term interest rates could still rise if inflation fears persist and uncertainty about government finances pushes markets to demand higher returns. In the report, figure 7 shows that consumers now expect inflation over the next five to 10 years to reach 3.7 percent, up from 2.7 percent before the pandemic.* Tariffs are partly driving these higher expectations. Additional upward pressure could come from investor risk concerns (term risk), as large government deficits and political uncertainty could push interest rates higher. If these expectations stick, borrowing costs for consumer and business loans could climb, making auto loans and major investments more expensive. While this scenario is not our base case, such dynamics are important risk factors to watch in 2026.
Beyond the AI boom lies productivity gains
From AI automation to acceleration.
Economic growth has been heavily shaped by the boom in AI investment this past year, and we expect that trend to continue into 2026. Our outlook for next year includes a large role for AI in shaping business investment, the labor market and productivity gains. Despite some possible risks, we anticipate 2026 to be a year where AI once again is a dominant force in the economy.
Business investment in AI is projected to accelerate in 2026, driven by the promise of competitive advantage and operational efficiencies. Growth in business investment was heavily skewed toward the tech sector this year, which was itself significantly driven by AI-related investments. This investment trend has been spurred by increased spending on AI, which worldwide is likely to reach $1.5 trillion by the end of this year and pass $2 trillion next year.* Venture capital funding and corporate spending on AI technologies are likely to drive further investment as companies increasingly prioritize AI in their digital transformation strategies. Additionally, they are increasingly using AI to target improvements in customer experience, supply chain management and product development. Due to these trends, we expect further divergence between tech and non-tech business investment in 2026.
AI is also expected to drive major divergences in the job market next year. We expect AI automation to reduce entry-level jobs in the knowledge economy that were classically more labor intensive such as paralegal work and entry-level coding. However, AI is also expected to create new employment opportunities in areas such as AI system development, data analysis, chip production, data center construction and ethical oversight. Despite new opportunities, the transition is likely to be disruptive. Substantial workforce reskilling and adaptation to new roles is almost certain to be a slow process and will likely lead to sustained unemployment for many current workers and future job seekers whose skills will be replaced by automation.
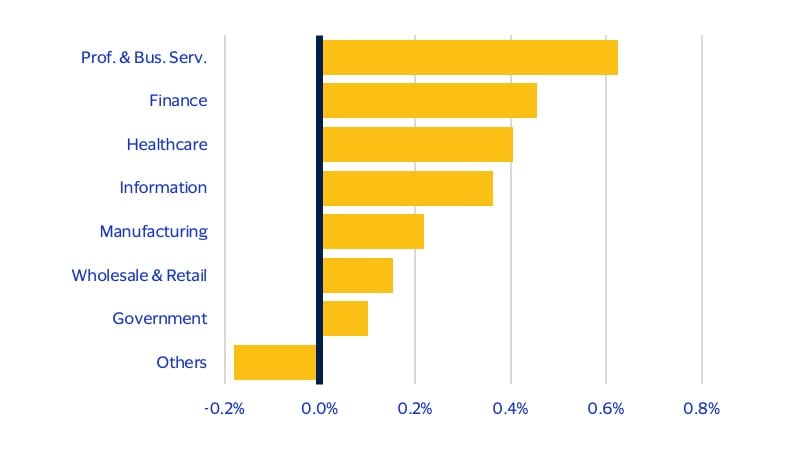
Artificial intelligence is also expected to drive significant gains in productivity across various sectors in 2026. AI adoption is most likely to have the largest impact on labor productivity in the professional and business services, finance, healthcare and information sectors where current labor-intensive job functions are most ripe for AI-driven automation. As a result, we expect these sectors to contribute the most to GDP growth next year (see figure below). The automation of routine tasks will allow workers in these sectors to focus on higher-value activities, potentially leading to greater efficiency. It will likely also create a divergence in output between sectors that more rapidly implement AI and those that are less able to harness AI for productivity gains.
Output growth strongest among AI adopting sectors
Contribution to 2026 YoY GDP growth by sector
* View these charts in the full PDF report.
Footnotes
- Alliance for Lifetime Income. https://www.protectedincome.org/the-peak65/
- Kramer S. and Passel, J.S. (Aug. 21, 2025). “What the data says about immigrants in the U.S.” Pew Research Center.
- Congressional Budget Office. “An update to the demographic outlook, 2025 to 2055”
- Lautz, A. and Snyderman, R. (May 16, 2025). “Which states benefit most from the SALT deduction?” Bipartisan Policy Center.
- Based on the Tax Policy Center analysis presented in Rubin, R. and Ebeling, A. (Oct. 25, 2025). “How to squeeze the most from the new SALT cap” The Wall Street Journal.
Forward-Looking Statements
This report may contain forward-looking statements within the meaning of the U.S. Private Securities Litigation Reform Act of 1995. These statements are generally identified by words such as “outlook”, “forecast”, “projected”, “could”, “expects”, “will” and other similar expressions. Examples of such forward-looking statements include, but are not limited to, statements we make about Visa’s business, economic outlooks, population expansion and analyses. All statements other than statements of historical fact could be forward-looking statements, which speak only as of the date they are made, are not guarantees of future performance and are subject to certain risks, uncertainties and other factors, many of which are beyond our control and are difficult to predict. We describe risks and uncertainties that could cause actual results to differ materially from those expressed in, or implied by, any of these forward-looking statements in our filings with the SEC. Except as required by law, we do not intend to update or revise any forward-looking statements as a result of new information, future events or otherwise.
Disclaimers
The views, opinions, and/or estimates, as the case may be (“views”), expressed herein are those of the Visa Business and Economic Insights team and do not necessarily reflect those of Visa executive management or other Visa employees and affiliates. This presentation and content, including estimated economic forecasts, statistics, and indexes are intended for informational purposes only and should not be relied upon for operational, marketing, legal, technical, tax, financial or other advice and do not in any way reflect actual or forecasted Visa operational or financial performance. Visa neither makes any warranty or representation as to the completeness or accuracy of the views contained herein, nor assumes any liability or responsibility that may result from reliance on such views. These views are often based on current market conditions and are subject to change without notice.
Visa’s team of economists provide business and economic insights with up-to-date analysis on the latest trends in consumer spending and payments. Sign up today to receive their regular updates automatically via email.