Valuing the unique identities and contributions of all employees

Inclusion and diversity is a business imperative, from our workforce to the products we design and the businesses we serve.

An inclusive and diverse workplace is a key priority for us

Our inclusion and diversity strategy helps us all reach our full potential.

Inclusion is at the heart of everything we do

Our impact comes from our people

Ana M., Director of Product Management in São Paulo, Brazil

"We drive financial inclusion for traditionally underserved segments of the population."

Titilope A., Senior Cybersecurity Engineer in Austin, Texas

“I’m part of a team that uses AI and innovative Visa tech to protect our global payments network and billions of users every day.”

Damijan P., Acceptance Development Sector Lead in Berlin, Germany

“Visa connects businesses to buyers…helping them digitize and grow because when everyone is included, good things happen.”

Eric L., Senior Business Development Leader in Singapore

“Visa fosters a culture of openness and knowledge sharing, which is really important for ensuring everyone feels included when they come to work.”

Awards and recognitions

We’re proud to be recognized for our diversity and inclusion efforts.

Our workforce by the numbers

Our workforce by the numbers[NDC1] [NDC2] 

 [NDC1]Section is currently US only. Do we want to keep it this way?

 [NDC2]Authoring concerns: Can Alex confirm if we want to use film strip or another component for authoring?

Visa has always been a diverse workplace, but there’s constant room for improvement. Here’s where we’re at today, both globally and in our largest market, the U.S.

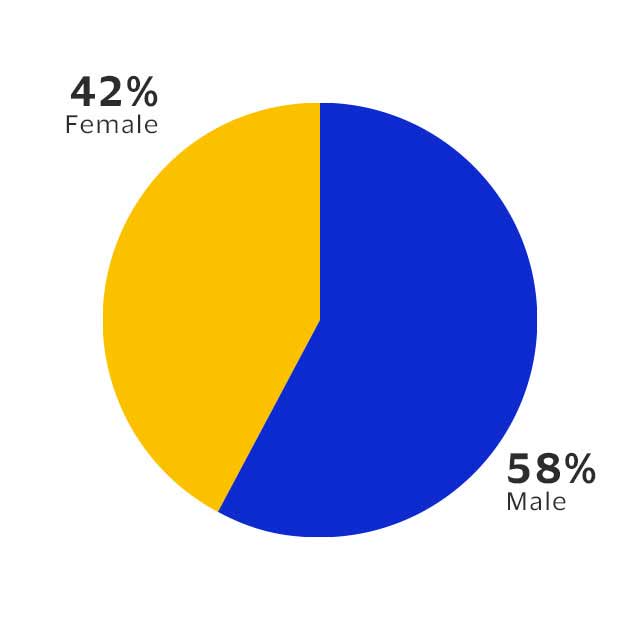
Gender in Global Workforce. See image description for details.

This pie chart shows the difference of gender in Visa’s global workforce with 42% in yellow representing female and 58% in blue representing male.

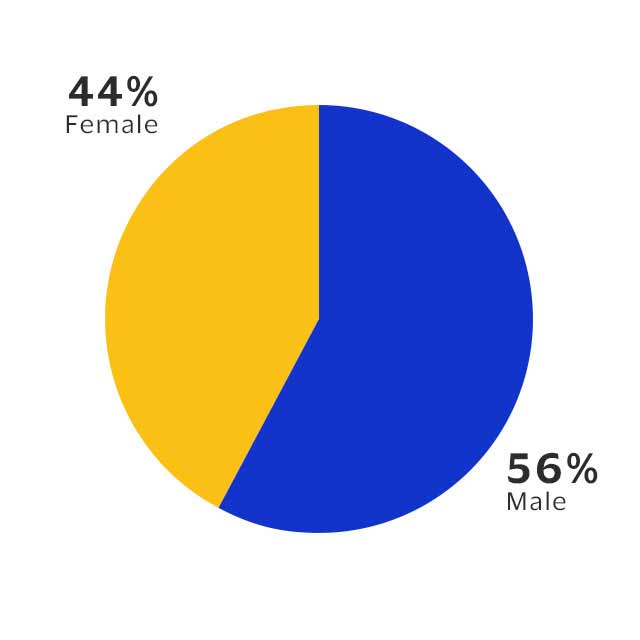
Gender in U.S. Workforce. See image description for details.

A simple pie chart that shows the difference between genders in Visa’s U.S. workforce with 44% in yellow representing female and 56% in blue representing male.

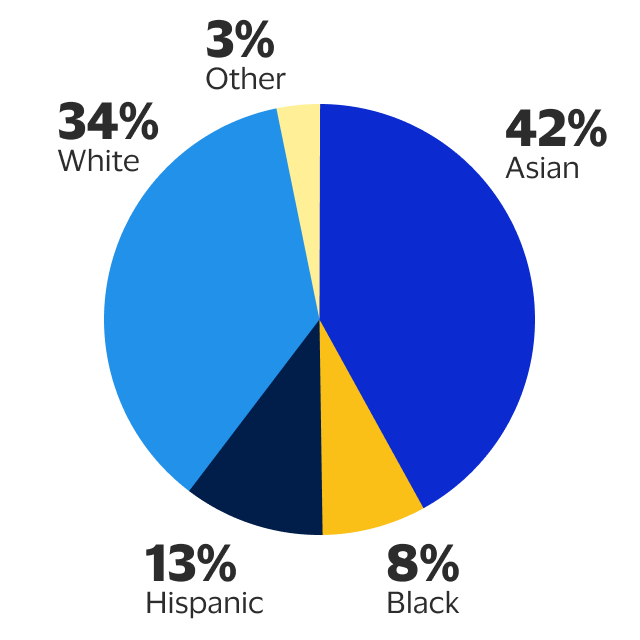
Ethnicities in U.S. Workforce pie chart. See image description for details.

A basic pie chart that demonstrates the various Ethnicities in Visa’s U.S. Workforce with 35% for white, 42% for Asian, 13% for Hispanic, 8% for black and 3% who classified as other.

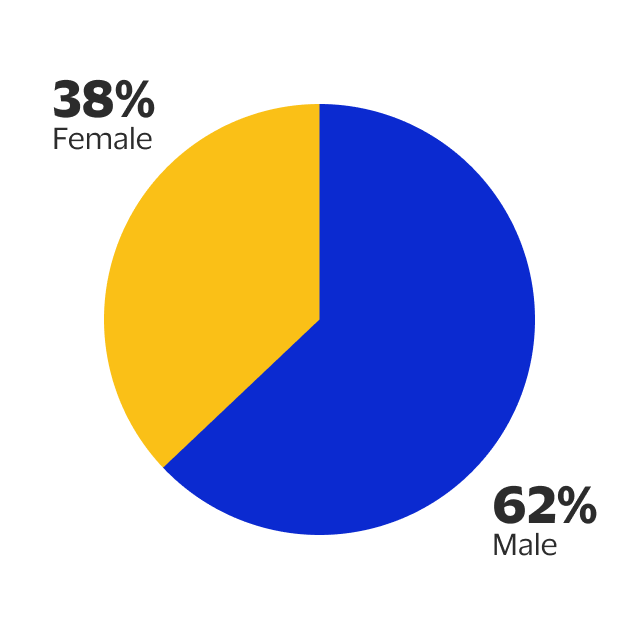
Gender in Global Leadership. See image description for details.

A simple pie chart that visualizes Gender in Global Leadership with 36% in yellow for female and 64% in blue for male.

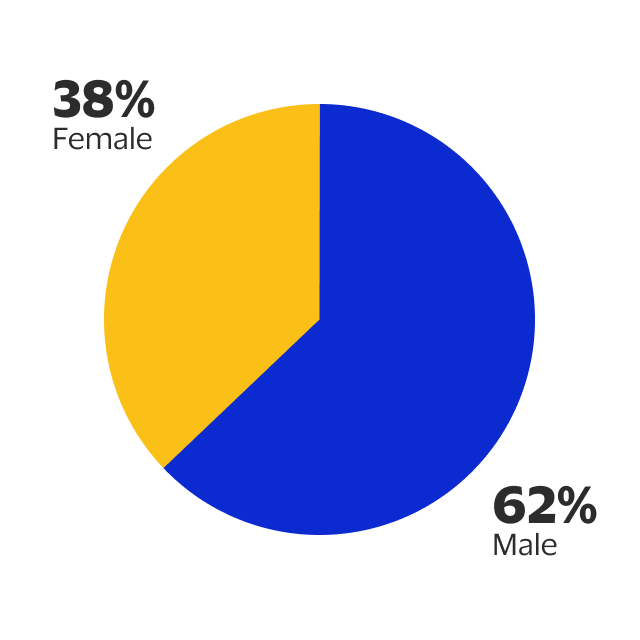
Gender in U.S. Leadership pie chart. See image description for details.

This pie chart shows the differences in gender in Visa’s U.S. leadership with 37% in yellow for female and 63% in blue for male.

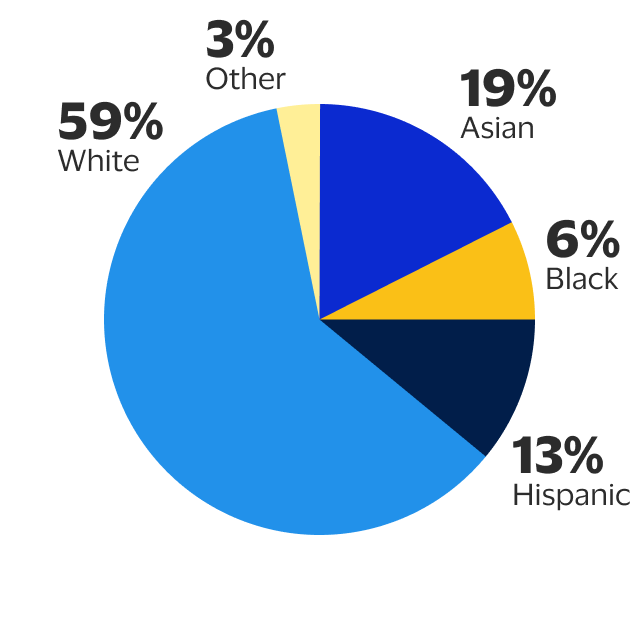
Ethnicities in U.S. Leadership pie chart. See image description for details.

This pie chart depicts the various Ethnicities in Visa’s U.S. leadership with 60% for white, 18% for Asian, 6% for Black, 13% for Hispanic and 3% who classified as other.

Footnotes

Share our values?

Join our team. A place where everyone belongs.