Making sense of stablecoins
Onchain analytics can help financial institutions cut through complexity

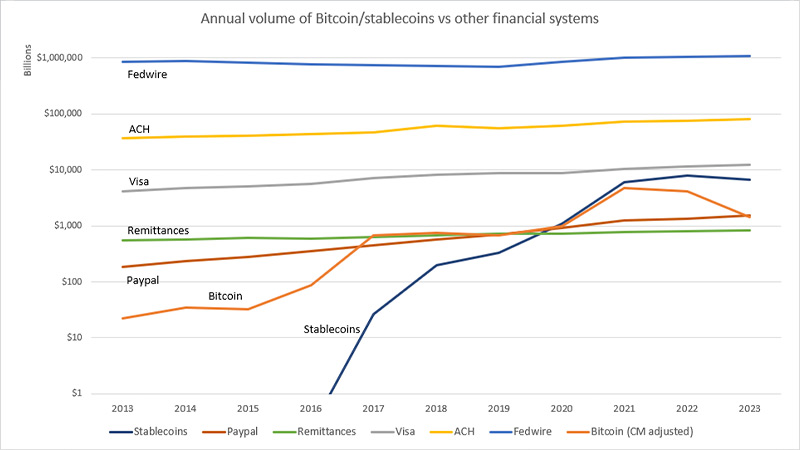
There’s a line chart that has made the rounds on social media under the headline “stable[coin]s are catching up to established settlement networks.”
It purports to show the volume that some of the world’s major settlement networks process annually, in billions of dollars, and compare those to annual stablecoin volumes. The chart shows Fedwire is way up at the top, followed by ACH, then Visa, an estimate of remittances and some other established payment platforms. All of the lines show a slow but steady rise over about 10 years’ time.
Then, there's the stablecoin line.
The stablecoin line seems to burst onto the scene around 2016 and shoots up like a rocket in just six short years.
Taken at face value, it’s an interesting chart. But I’d argue that this comparison doesn’t really tell the full story.
Stables are catching up to established settlement network
In stablecoin data, there is a lot of noise.
What’s unique about stablecoins compared to other payment and settlement networks is that, because they are issued and transferred over public blockchain networks, stablecoin transaction data is publicly available in real time.
However, accessing and organizing this data requires knowledge and expertise in how blockchains operate. This can be challenging, particularly when stablecoins are used across many different blockchains that each have their own nuances.
There is also a lot of noise in this data given that blockchains are general purpose networks where stablecoins can be used across a range of use cases with transactions that can be initiated manually by an end user or programmatically through bots.
For instance, developers can create automated bot programs that perform activities such as stablecoin arbitrage, liquidity provision, and market making, among others. These activities are vital for sustaining the growing decentralized finance (defi) ecosystem. However, the onchain transactions resulting from interactions with these automated programs don't resemble settlement in the traditional sense.
We think this programmability of transactions that blockchains enable is unique, however it’s hard to compare these transactions to the kind of organic payments activity that is more likely initiated by an end consumer or business.
In this light, what does the data actually say, clearly and plainly, adjusting for inorganic activity from bots and other artificially inflationary practices?
Why the Visa Onchain Analytics Dashboard?
That, in a nutshell, is what the Visa Onchain Analytics Dashboard aims to address. We’ve partnered with the blockchain data provider Allium Labs to create a dashboard that is designed to be an easily-digestible, freely-available window into publicly-available aggregated blockchain data, beginning with stablecoins. From information on active users, to volumes by coin and blockchain, to transaction sizes and a continuously evolving set of stablecoin metrics, the Visa Onchain Analytics Dashboard looks to provide clear insights into stablecoin activity—insights that enable anyone interested in the stablecoin ecosystem to easily access and follow.
Looking at the data, we’ve found three notable trends relating to the current state and potential of stablecoins:
- Stablecoin supply is approaching all-time highs. Total demand for stablecoins has picked back up in 2024, with circulating supply approaching $150B.
- Steady growth of monthly active stablecoin users. We are seeing growth in regular users of stablecoins, with 27.5M monthly active users across all chains.1
- Discrepancy between total transfer volume vs. bot-adjusted transfer volume. When we apply a simple heuristic that removes inorganic data, we see that transfer volume for the last 30 days can be adjusted from $2.65T to $265B2
As a company, Visa has been at the forefront of digital payments for nearly sixty years, studying value transfer and application of financial data. We have deep expertise and history around the myriad ways consumers and businesses use payment products. And we make it our business to understand deeply any new technologies that can facilitate money movement as they emerge.
We also welcome a conversation — around what’s here and what’s not, and what could make this tool better. What are the best methodologies for adjusted volume to understand organic activity? What metrics are important for your particular segment? What could be more clear or more focused? What do you wish you might gain from this tool?
To view Visa Onchain Analytics Dashboard, visit http://visaonchainanalytics.com/.
Disclaimers:
Case studies, comparisons, statistics, research and recommendations are provided “AS IS” and intended for informational purposes only and should not be relied upon for operational, marketing, legal, technical, tax, financial or other advice. Visa Inc. neither makes any warranty or representation as to the completeness or accuracy of the information presented, nor assumes any liability or responsibility that may result from reliance on such information. The information contained herein is not intended as investment or legal advice, and readers are encouraged to seek the advice of a competent professional where such advice is required.
1 As of 4/24/24
2 As of 4/24/24