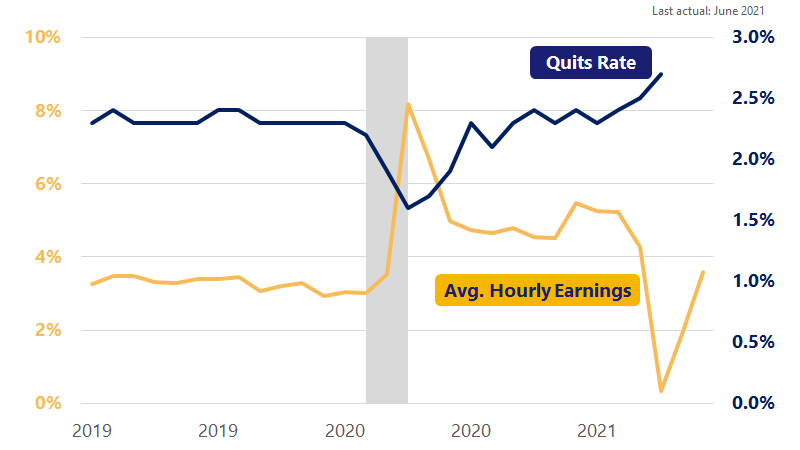
July 14, 2021 – After coming in below expectations for two months in a row, nonfarm payrolls rose a robust 855,000 in June while the unemployment rate edged higher. It would not surprise us if June’s payroll gain is revised lower in next month’s report. The Bureau of Labor statistics noted that seasonally adjusting the jobs numbers has become more difficult, because returning to in-person learning and other school activities have distorted the typical seasonal patterns. Beyond the quirky seasonal patterns, building wage pressure is emerging as a clear trend. Average hourly earnings rose 3.6 percent year-over-year (YoY) in June. Even after accounting for last year’s low readings, wage growth is on a higher growth path than before the pandemic. The increasingly tight labor market is fueling wage gains. The share of employees who quit their jobs as a share of total employment—the so-called quits rate—rose to a record high since the series began in 2000. The Fed has been in wait-and-see mode as the labor market continues to recover, and this month’s employment report will likely support its case. With inflation hitting above the Fed’s two percent target, we expect the Fed to start tapering its monthly asset purchases as it walks a tight rope between supporting the economy and letting it overheat.
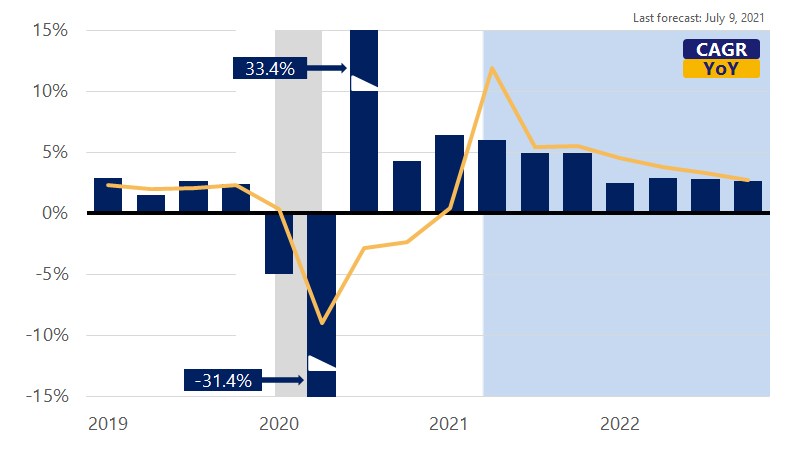
In this update we downwardly revised our outlook for GDP growth to 5.7 percent for this year as incoming data suggests business investment will be a bit softer than expected. We are assuming the bulk of supply chain disruptions will subside by Q4 of this year and thus have upwardly revised our 2022 GDP growth forecast to 3.6 percent.