February 15, 2021 – Running up the score in the first half
With the conclusion of the big game (proudly sponsored by Visa), attention of this team of economists now turns to reading the incoming economic data for signs of how Q1 is shaping up. While it would be easier to just punt and cite the ongoing uncertainty, we have crunched the numbers and now think that Q1 gross domestic product (GDP) growth will be much stronger than expected. Two key factors led to our sharp upward revision for both the first and second quarters of this year. First, it now appears that the most recent stimulus package, passed in December, had a greater influence on consumer spending than first thought. Real-time consumer spending data indicates that spending surged in January. Second, another $1.9 trillion stimulus package will likely be passed sometime before the end of Q1. Given the size of the package, we now expect GDP growth to hit 5.5 percent in Q2 as the stimulus checks and other programs lift growth. While we expect the stimulus program to lift consumer spending, we think it will also likely slow the pace of the labor market recovery.
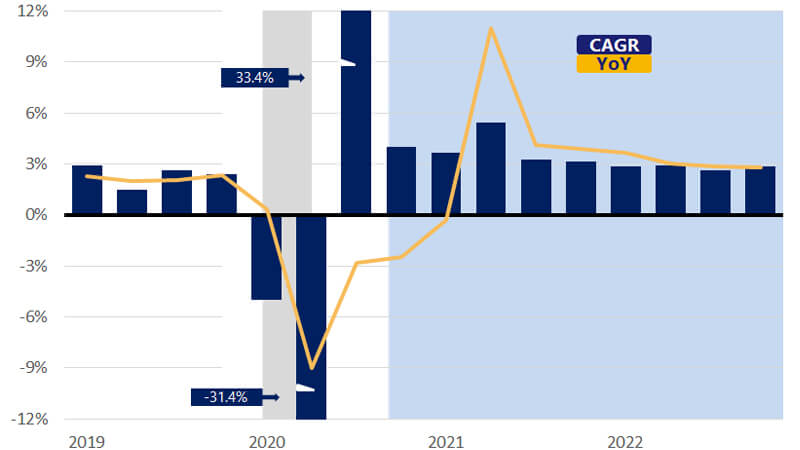
With the changes to the outlook this month, we now expect GDP growth to rise 4.5 percent in 2021 compared to the 3.5 percent contraction in 2020. Looking ahead to 2022, we expect GDP growth at 3.1 percent as the gradual labor market recovery begins to take hold. Thematically, the first half of this year will represent solid economic growth before downshifting slightly in the latter half of the year (bottom left chart). A stimulus-fueled pick-up in consumer spending, a solid housing market, and improving business investment should all support growth.