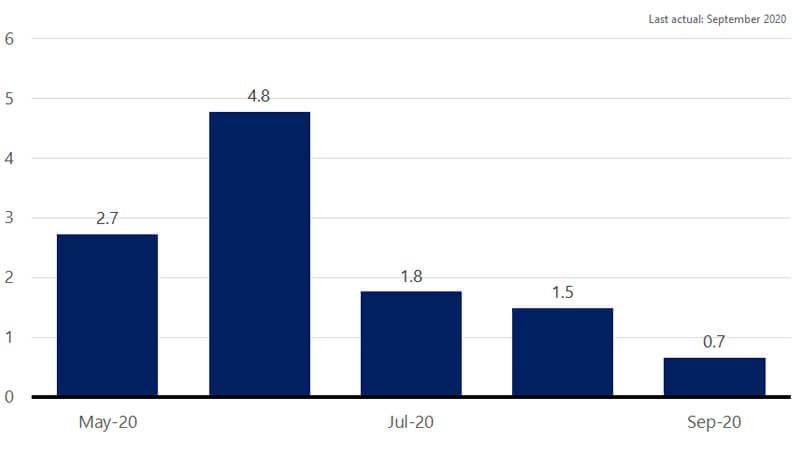
October 13, 2020 — As we begin the fourth quarter of what has been a wild year for the economy, a clear trend is beginning to emerge in the data: the U.S. economic recovery is losing some momentum. Monthly job growth downshifted in September for the third month in a row. Personal income growth turned sharply negative again in August, following the expiration of the enhanced unemployment insurance benefits, leading to a downshift in the pace of overall consumer spending. The evidence seems clear that in the absence of further stimulus, the U.S. economy is at risk of settling back into a very modest pace of economic growth. The persistent negative headlines around the virus outbreak are likely to continue weighing on consumer psychology and thus throttle back the pace of the recovery.
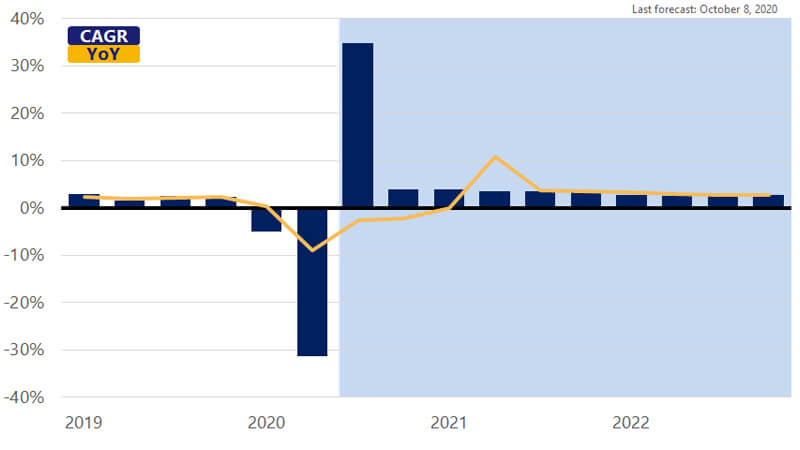
In response to the slower pace of improvement in the economic data, we have downwardly revised our estimate for fourth quarter GDP growth to 3.9 percent (annualized). Looking ahead to 2021, GDP growth is expected to rise 4.4 percent before settling into a more modest 2.9 percent pace of growth in 2022. There remain considerable downside risks to the outlook for Q4-2020 and Q1-2021 as the consensus among healthcare experts indicates another wave of virus cases is imminent. Should such a wave materialize and shelter-in-place orders be reintroduced, the result would be a significantly increased probability of a double-dip recession later this year and into the first quarter of 2021.