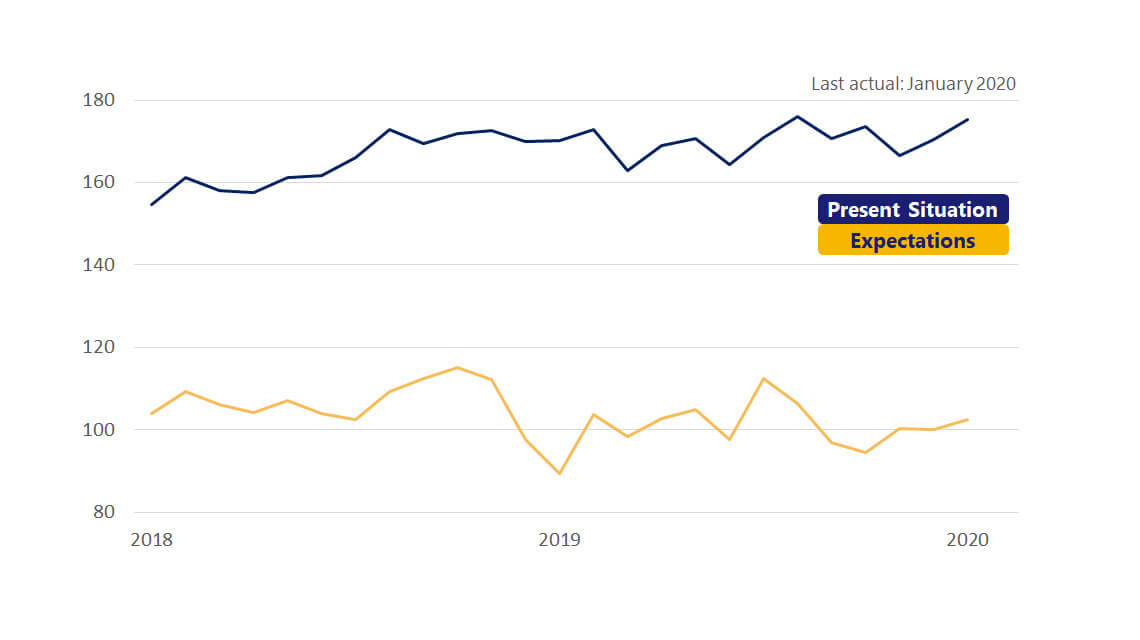
February 19, 2020 – Economic data for January pointed towards a solid start to 2020. Both consumer confidence readings and nonfarm employment gains helped to reinforce the strength of the consumer sector. Measures of business confidence also turned higher for both the service and manufacturing sectors. There is some uncertainty building, however, as ongoing fallout from the coronavirus continues to rattle equity markets and will likely delay a Q1 rebound in global economic growth.
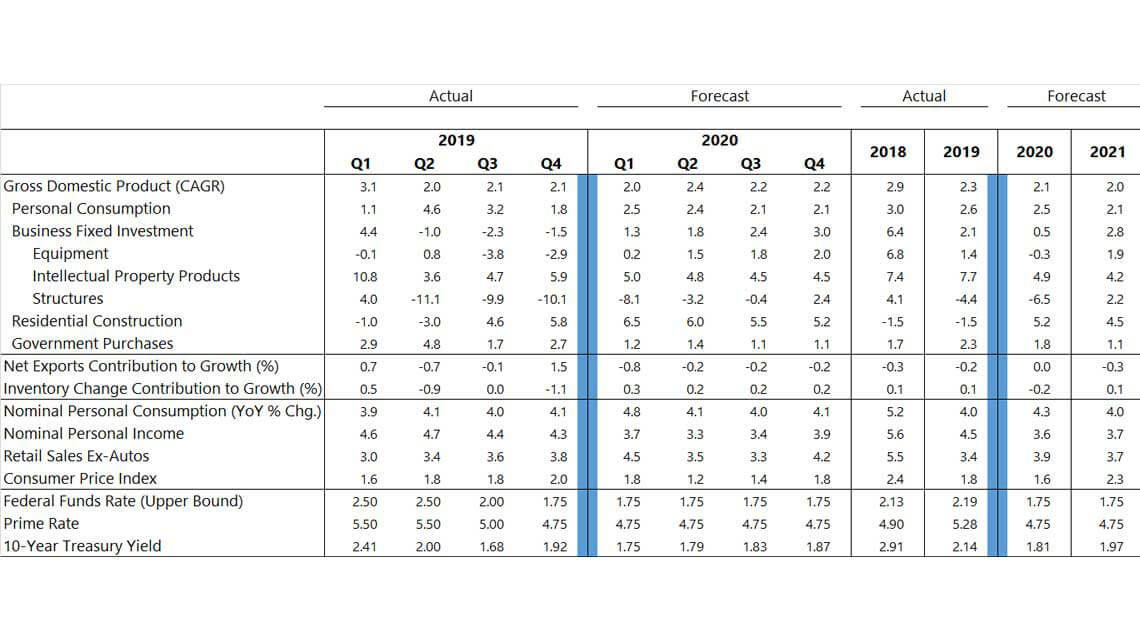
This month we have upwardly revised our outlook for Q1 GDP growth to 2 percent, with consumer spending, residential investment and a bounce back in inventory building all helping to lift our estimate for Q1. Net exports are expected to weigh on growth in Q1 as an imports surge (following a sharp decline in Q4) and exports are weighed down by ongoing sluggish global economic growth. Business investment is expected to remain soft once again as uncertainly about the magnitude of the global economic disruption materializes from the coronavirus. Our full year estimate of GDP growth for 2020 now stands at 2.1 percent, with only a slight downshift in growth for 2021 to 2 percent.

