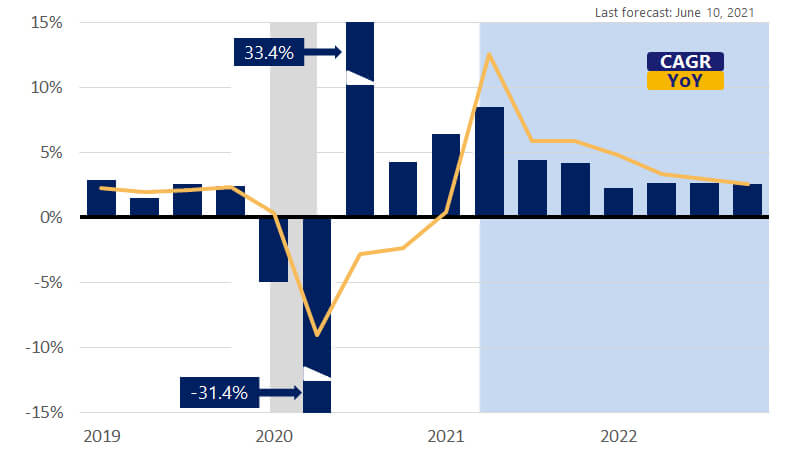
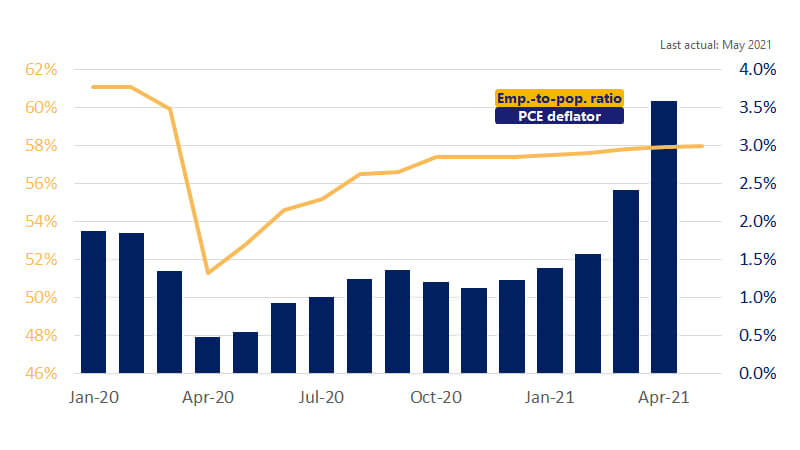
June 25, 2021 – Incoming economic data over the past month continues to reflect an economy that would be growing faster were it not for supply constraints. Labor market conditions are still improving. First time filings for jobless benefits continued to fall rapidly as employment in May rose by 559,000. Wages are also increasing as available labor remains tight in some industries. Purchasing managers survey data still points toward tight inventories and a backlog of orders, which is leading to higher prices passed on to consumers and businesses. Even in light of higher prices, consumer and business spending remains robust. We estimate that real consumer spending will rise 11 percent (annualized) and real business fixed investment will climb 8 percent (annualized) this quarter. One area that is cooling off is the housing market. Real residential investment will likely expand at a more modest 3 percent (annualized) pace this quarter, down from the 12.7 percent pace in Q1. With robust economic growth, a firming labor market and inflation pressures building, attention is now turning to when the Fed may remove the punchbowl of accommodation that has helped to fuel the strong recovery.
This month we upgraded our outlook through next year. We now expect gross domestic product (GDP) growth to expand 6 percent in 2021 and 3.4 percent in 2022. Robust consumer spending will support further business investment, while existing stimulus programs will lift federal, state and local spending through the second half of this year and into 2022. Domestic inventory rebuilding efforts will also support growth in second half as firms recover from the surge in demand.

