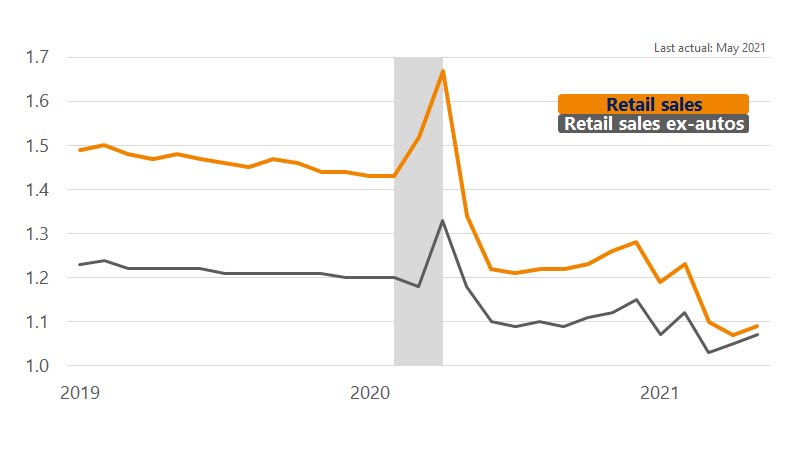
August 17, 2021 – Since last month’s update, we learned that the economy expanded 6.5 percent (annualized) in the second quarter.² Initial data on Q3 has also been promising to-date, with 943,000 jobs added in July and average hourly earnings rising 4 percent year-over-year (YoY).³ The July Visa Spending Momentum Index (SMI) provided our first look at consumer spending for the quarter, which also pointed towards continued robust consumer spending activity.⁴ There are some challenges, however, that may begin to limit consumer spending in the coming months. Namely, the ongoing global supply chain disruptions. Auto sales slid for three months in a row now,² not for lack of demand, but rather a global auto chip shortage that is preventing some car makers from keeping vehicles in stock. The surge in U.S. domestic demand has also created challenges for key U.S. ports trying to keep up with demand. Several U.S. ports remain backlogged and are struggling to get the plethora of container ships unloaded (‘sitting on the dock of the bay’…). These are just two examples of the challenges associated with trying to service the robust rebound in U.S. consumer spending. Retail inventories as of May were down to less than 1.1 months of supply left.⁵ There are some signs that things are easing but it will likely take a couple of quarters for global supply chains to catch-up. We estimate that real gross domestic product (GDP) growth will expand 5.4 percent (annualized) in Q3, with a whopping 2.7 percentage points coming from inventory rebuilding.
GDP growth in this month’s outlook is expected to rise 5.9 percent YoY this year before downshifting to 3.5 percent in 2022.