Impact of Asia Pacific travelers visiting U.S. national parks
July 24, 2017 – As the number of Asia-Pacific households travelling abroad rises 48 percent to a projected 109 million by 2025, the destinations they visit could undergo fundamental change. The U.S. national parks are among the destinations that could be transformed with the rise of a new travelling class in the region. Last year, nearly one million AP travelers visited the parks, according to Visa estimates, but these numbers are likely to climb as this emerging Asia-Pacific travelling class increasingly ventures out.*
By leveraging the millions of transactions that flow across the Visa network, combined with park visit data published by the U.S. National Park Service, Visa is able to provide a view into foreign travel patterns and spending in and around the iconic U.S. national parks that was previously unavailable due to the limitations of traditional data sources.
Visa international economist Richard Lung discusses growth in Asian travel to U.S. national parks

Travelers from Asia are the fastest growing segment of visitors to the national parks, as their visits grew 13 percent in 2016, faster than the 10 percent growth in all visitors. One in six foreign visitors to the national parks in 2016 came from the Asia Pacific region. Similar to their U.S. counterparts, AP travelers prefer to visit the parks over the summer (June-August), which accounts for more than 40 percent of total AP visits.
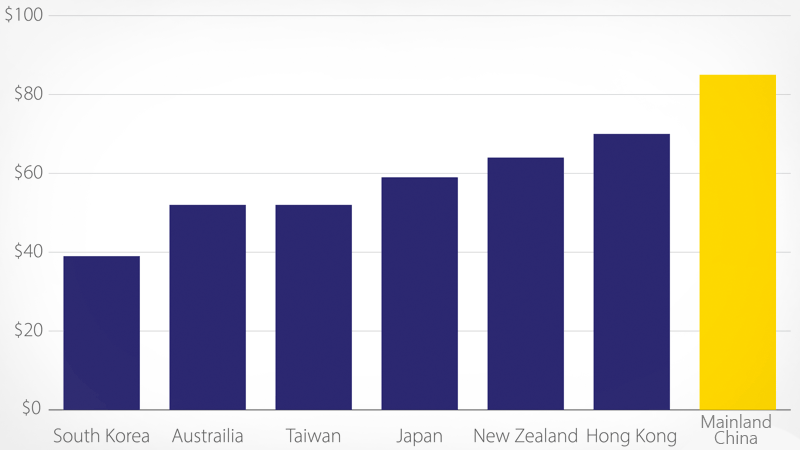
Asia Pacific travelers—especially visitors from China—also impact the local economy more significantly than other foreign travelers. Chinese travelers, for example, spend about $85 overall while visiting the U.S for every one dollar spent on average at the national parks, compared to $50 for other foreign visitors, according to Visa estimates.
For every $1 spent in the U.S. national parks, Chinese visitors spent $85 outside the parks

Source: VisaNet
In 2016, Chinese travelers accounted for 7 percent of overseas national park visitors, overshadowing other Asia Pacific visitation rates (Australia, at 3 percent, had the second-highest visitation rate).
Some AP visitors make a grand circuit, including several national parks during their time in the U.S. More than one out of four AP visitors to the Grand Canyon during the summer of 2016, for example, also visited a park in California or Utah.
In the summer of 2016 (June-August 2016), 82 percent of Chinese visitors to the Grand Canyon also visited Arizona, California and Nevada—though two-thirds of this group’s spending took place in California alone. Not surprisingly, the primary spend categories in the three-state area included lodging, restaurants and auto rentals; 45, 44 and 68 percent of this group’s spend in each of these categories, respectively, took place in California.
* “Mapping the Future of Global Travel and Tourism", Visa Travel Insights
Methodology
Visa International Travel (VISIT) database is a proprietary model that combines Visa's cardholder data with publicly-available cross-border arrival statistics. The database provides a comprehensive view into high-frequency cross-border travel flows, currently encompassing the top 82 origin and destination countries, which collectively account for more than 80 percent of global travel.
VISIT combines unique counts of Visa cardholders that register a face-to-face transaction at a merchant outside their home country in a given calendar month with other transaction data such as average spend per cardholder, card usage patterns at lodging merchants and others. Visa uses this data to econometrically model official arrival statistics compiled by various government sources and to generate estimates that fill in the large gaps existing in the cross-border travel data.