January 2022 – Parsing current trends to see what 2022 will bring seems as fraught with uncertainty as any time over the past two years since the pandemic began. After one of the strongest fourth quarters on record for consumer spending, the emergence of the Omicron variant and the return of public health interventions to contain its rapid spread now cloud the outlook.
Just as medical advancements provide us with better tools to mitigate the health risks from new outbreaks, new data tools launched during the pandemic bring greater clarity and certainty into what this latest phase of the pandemic might bring. Using such tools, including the Visa Spending Momentum Index, reveals three insights into the pandemic’s evolving influence on the economic recovery:
- Consumer spending may slow as a result of the Omicron variant, but the potential shock will be less: each successive variant’s impact on spending has been less than the one before.
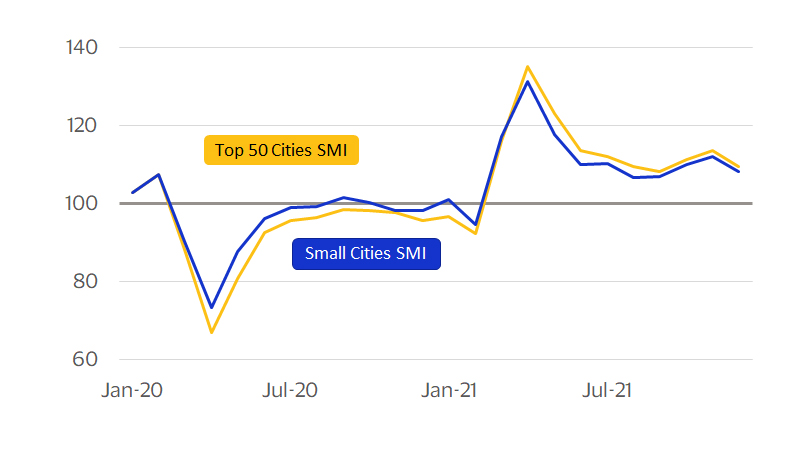
- The recovery is moving to a more sustainable footing as some of the initial unevenness linked to the pandemic is dissipating. Spending by the affluent and within large cities has recovered.
- Although each wave is now having less of an impact on consumer demand, it still has the power to disrupt the supply of services and goods as sickness sidelines workers. As such, COVID-19 could temporarily contribute to higher inflation than traditional models would suggest until it moves from being pandemic to endemic.