Economic outlook and forecasts This holiday season’s price tag tells the real story

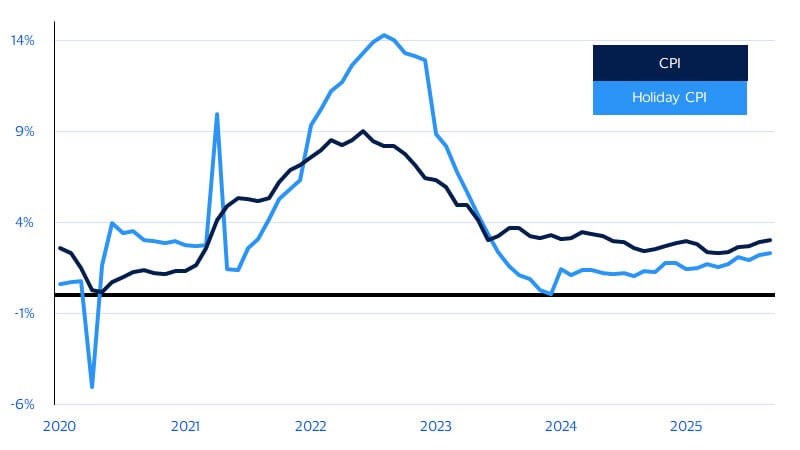
October 2025 – As the holiday season nears, it caps off a year marked by extreme economic uncertainty, slowing job growth, elevated inflation, resilient income growth, and even a government shutdown. Through it all, consumer spending has remained a steady force, and we expect that resilience to continue. But with higher prices playing a larger role in driving nominal growth, the real story this season may be how far consumers can make each dollar stretch. After peaking at 9 percent growth on a year-over-year (YoY) basis in 2022, inflation—as measured by the Consumer Price Index (CPI)—has gradually moderated.¹ In the first half of this year, the CPI increased 2.6 percent YoY, bottoming out at 2.3 percent in April. However, persistent pressures from shelter and food costs, tariff impacts, and rising inflation expectations reignited upward momentum, pushing CPI growth to 3 percent in September.
This broader trend is also captured in our newly developed holiday CPI—a tailored index that mirrors the typical basket of goods sold during the season—which shows that inflation for holiday sales is quickly catching up to the pace of the overall CPI (see figure below). In particular, inflation for recreational goods, which makes up about 30 percent of the holiday sales CPI basket, surged 3.1 percent YoY in September. We are also paying close attention to real disposable income growth, which has downshifted in the past 12 months.² But this downshift is more attributable to elevated inflation than a collapse in income growth. Consumers still have runway to spend, and despite pessimistic consumer confidence readings, they continue to do so, albeit more modestly. We see holiday sales* rising 4.6 percent YoY this season, or 4.5 percent if the month of October is included. But given pricing pressures, inflation will likely make a larger contribution to holiday sales growth this year.
Inflation for holiday sales vs. overall inflation as measured by the Consumer Price Index (CPI)
Seasonally adjusted, year-over-year percent change
The stockings (and spending) are hung with care
One of the more confounding aspects of the current economy is how well consumer spending has held up despite the trifecta of weaker job growth, elevated inflation and extreme economic uncertainty. These headwinds have weighed heavily on soft data from consumer sentiment surveys, but they have not yet derailed backward-looking, quantifiable measures of economic activity (i.e., “hard” data). For example, in the years preceding the pandemic, there was a modest link between changes in consumer confidence and changes in spending, but that mold has broken down in recent years.† In April, consumer confidence fell to its lowest level since the throes of the pandemic in 2020, but real consumer spending increased 3.1 percent YoY—the same average pace of growth over the previous 12 months. This is not to say that consumers aren’t feeling the pinch from higher prices and ongoing uncertainty. Real spending growth has since moderated to 2.7 percent YoY as of August, the latest data available. But this divergence suggests that while confidence is low, actual consumer spending remains relatively resilient.
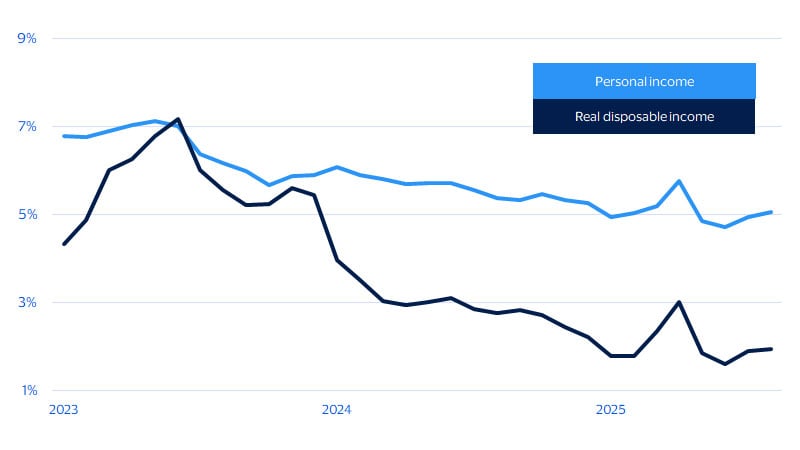
The downshift in real consumer spending growth is expected to continue into the holidays, but we believe consumers can maintain spending at a steady, albeit slower, pace. One reason is that income growth continues to hold up even as the job market weakens. There are fewer job openings, but mass layoffs have not materialized—thanks in part to sustained consumer resilience and ongoing labor shortages. The below figure illustrates the contrast between stable nominal income growth and the more pronounced and persistent slowdown in real disposable income growth—that is, income adjusted for inflation and taxes, which reflects consumers’ true purchasing power. Although nominal income is partially propped up by inflation, the sharper decline in real disposable income growth indicates that consumers may have less to spend this holiday season than they did last year. While holiday sales may appear solid, elevated prices will obscure weaker underlying real purchasing power.
Nominal income is bright, but real (inflation-adjusted) income growth is light
Nominal personal income vs. real disposable income (Seasonally adjusted, year-over-year percent change)
Yule be surprised to hear sales are expected to hold up this year
With inflation on holiday-related items higher this year than last season, we expect nominally reported holiday sales to rise 4.6 percent YoY this year, up from a 4.3 percent pace last year. † Aside from higher-priced holiday goods pushing our forecast higher, the additional shopping day this season will help provide a slight tailwind to sales. For retailers, though, it may not feel like a holly jolly shopping season. After accounting for inflation on holiday items, real spending—a good proxy for foot traffic—is expected to rise just 2.2 percent this year, down from the 2.5 percent real spending that occurred last season. The holiday shopping season continues to become more spread out across the fourth quarter and as such we also estimate holiday sales including the month of October. Under this broader definition, we expect holiday sales to rise 4.5 percent YoY, down from 4.8 percent in 2024.
Our forecast this season is consistent with findings from our latest quarterly consumer survey results, which show consumers expect to spend more this holiday season compared to last year. Per the latest Visa Business and Economic Insights quarterly consumer survey fielded in October 2025, consumers said they plan to spend an average of $736 on holiday gifts,† marking a roughly 10 percent rise from the $669 reported in 2024.³ This uptick reflects a resilient willingness to spend, even as economic uncertainty and inflation persist.
Lots of happy grandchildren this holiday season: Holiday spending increases may be led by baby boomers
While overall holiday spending is set to climb again this year, demographic differences, particularly generational, are quite prominent. Baby boomers are taking the mantle from Gen X, who led holiday spending intentions last year. While Gen Z, millennial, and Gen X consumers expect to spend between 5 to 7 percent more on the holidays, baby boomers are planning to increase their holiday spending by 21 percent this year to an average budget of $855.03,⁴ largely because they have more people to buy for and are acutely aware of rising prices. Their willingness to spend reflects both a sense of obligation to loved ones and an understanding that holiday goods cost more than last season.† The increase in average spending suggests that, despite softer consumer confidence and slower income growth, holiday shopping remains a priority for many households.
Among the 17 percent of consumers who do say they will spend more this holiday season, just over one-third indicate more people to buy for this year† as the impetus, with one-quarter citing increased confidence in the economy. Those who plan to spend less—nearly 20 percent of the consumer population—cite a lack of extra income or lower confidence in the economy as a reason for pulling back. As in 2024, the online channel, particularly via mobile device, is the channel of choice for many consumers, with over 45 percent of consumers saying they plan to use their mobile devices for most or all of their holiday shopping.
* We define holiday sales as non-seasonally adjusted nominal retail sales on all forms of payment, less sales at automotive dealers, gas stations and restaurants, for the months of November and December as reported by the U.S. Department of Commerce.
† View this chart in the full PDF report.
Footnotes
- Visa Business and Economic Insights and U.S. Department of Labor
- Visa Business and Economic Insights and U.S. Department of Commerce
- Visa Business and Economic Insights Quarterly Consumer Survey, October 2025
- Visa Business and Economic Insights Quarterly Consumer Survey, October 2025
Forward-Looking Statements
This report may contain forward-looking statements within the meaning of the U.S. Private Securities Litigation Reform Act of 1995. These statements are generally identified by words such as “outlook”, “forecast”, “projected”, “could”, “expects”, “will” and other similar expressions. Examples of such forward-looking statements include, but are not limited to, statements we make about Visa’s business, economic outlooks, population expansion and analyses. All statements other than statements of historical fact could be forward-looking statements, which speak only as of the date they are made, are not guarantees of future performance and are subject to certain risks, uncertainties and other factors, many of which are beyond our control and are difficult to predict. We describe risks and uncertainties that could cause actual results to differ materially from those expressed in, or implied by, any of these forward-looking statements in our filings with the SEC. Except as required by law, we do not intend to update or revise any forward-looking statements as a result of new information, future events or otherwise.
Disclaimers
The views, opinions, and/or estimates, as the case may be (“views”), expressed herein are those of the Visa Business and Economic Insights team and do not necessarily reflect those of Visa executive management or other Visa employees and affiliates. This presentation and content, including estimated economic forecasts, statistics, and indexes are intended for informational purposes only and should not be relied upon for operational, marketing, legal, technical, tax, financial or other advice and do not in any way reflect actual or forecasted Visa operational or financial performance. Visa neither makes any warranty or representation as to the completeness or accuracy of the views contained herein, nor assumes any liability or responsibility that may result from reliance on such views. These views are often based on current market conditions and are subject to change without notice.
Visa’s team of economists provide business and economic insights with up-to-date analysis on the latest trends in consumer spending and payments. Sign up today to receive their regular updates automatically via email.