U.S. Monthly Consumer Monitor February 2023

The consumer in January: New year new me
February 2023 – After ending 2022 with several weak readings, retail sales took a surprising turn to the upside in January 2023, increasing by 3 percent month-over-month.¹ To put this into context, during the last 30 years, retail sales have only risen this quickly during periods with federal stimulus or during months following major disasters (March 2021, December 2020, May-June 2020, October 2001). The January 2023 numbers were driven by gains across virtually every major retail category, including restaurants, car dealerships, furniture shops and electronics stores. Weather likely played a role in the soft December performance and the strong January rebound. During the last week of December, much of the country was hit with a “bomb cyclone” and entered a deep freeze, keeping consumers away from stores and car lots. January, by contrast, was unseasonably warm, giving  people the opportunity to shop, dine out, and purchase a new vehicle.

Fig. 1: Retail sales (Seasonally adjusted, month-over-month percent change)

Retail sales line chart. See image description for details.
Line chart showing the seasonally-adjusted month-over-month percent change in retail sales, which begins in January 2022 at 2.5 percent, declines to -0.4 percent by July, accelerates to 1.1 percent by October, declines to -1.1 percent in both November and December, and ends at 3.0 percent in January 2023.
Sources: Visa Business and Economic Insights and U.S. Department of Commerce

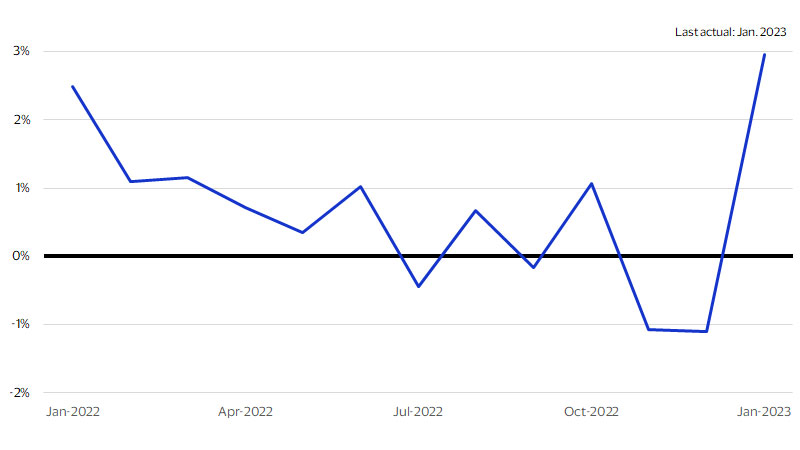
What’s behind the January numbers?

Aside from weather effects, the retail spike can largely be explained by income growth. The economy gained half a million jobs in January,² suggesting that many consumers got a paycheck for the first time, while others likely got a raise. Retirees benefitted from a Social Security cost-of-living adjustment (COLA), which increased the average Social Security payment by $110 per month, totaling almost $9 billion for approximately 70 million recipients.³ Because they are beyond the phase of life that is focused on saving, retired individuals spend virtually all of their income, suggesting the COLA created a multi-billion dollar boost to consumer spending. This theory is supported by the Spending Momentum Index (SMI), Visa’s proprietary data on consumer activity, which shows that spending momentum expanded faster in January for baby boomers than any other generation.⁴ Lastly, technical details of the Department of Commerce’s retail data could have over-emphasized the January increase. The Department of Commerce adjusts the data for typical seasonal patterns, but this seasonal adjustment process has become more challenging, potentially leading to artificially soft readings in December and strong results in January.

Fig. 2: Spending Momentum Index, by generation (month-over-month change)

Smi by generation bar chart. See image description for details.
Bar chart showing the month-over-month change in the Spending Momentum Index for Gen Z, millennials, Gen X, and baby boomers. Gen Z had the smallest month-over-month change at 1.5. The change increases sequentially by generation, with the fastest change occurring for baby boomers at 3.6.
Source: Visa Business and Economic Insights and VisaNet

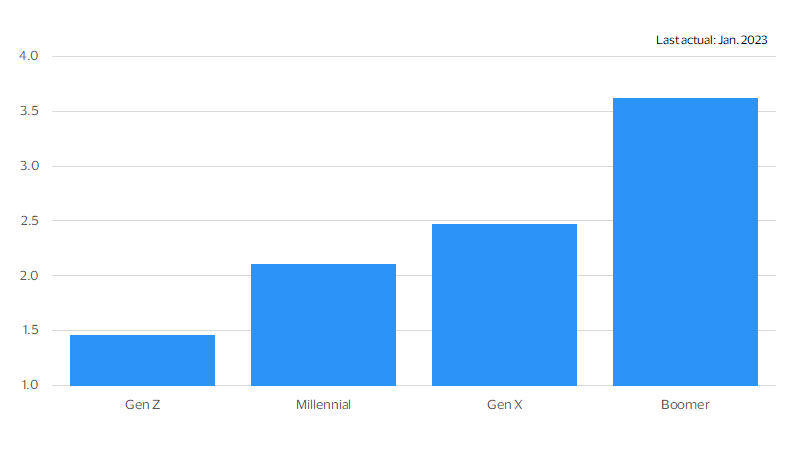
Will strong spending growth continue in 2023?

January data suggest that consumer spending, as well as broad-based economic growth, could be strong in early 2023. In the aggregate, households still have pandemic savings in the bank, and most have healthy balance sheets with low debt-to-income ratios.⁵ We may be approaching the point where incomes consistently outpace inflation, allowing the consumer to continue spending freely. But there are still many warning signs on the horizon, and the risks of recession remain high. The Federal Reserve is expected to continue hiking interest rates, and the full effects of higher rates have yet to hit the economy. Layoff announcements are accelerating,⁶ and the economy may begin to lose jobs in the near future. If these (or other) headwinds become more prominent, consumer activity could be bumpy in 2023.

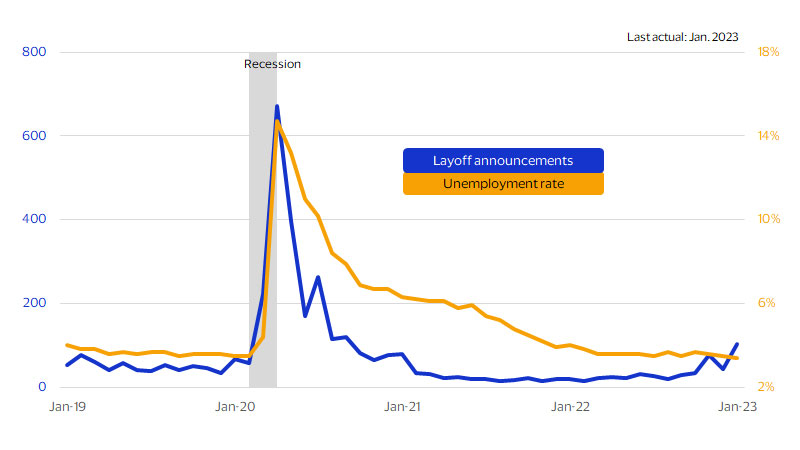
Fig. 3: Layoff announcements and unemployment (Announcements = thousands, unemployment rate = %)

Layoffs and unemployment rate line chart. See image description for details.
Line chart with a line for announced layoffs and another line for the unemployment rate. Announced layoffs begin in January 2019 at 53,000 and remain relatively constant through January 2020. They rise to 671,000 by April 2020, descend to 35,000 by February 2021, and remain relatively constant through September 2022. They begin to increase in October 2022 and reach 104,000 by January 2023. The unemployment rate begins in January 2019 at 3.8 percent, falls to 3.5 percent by January 2020, rises to 14.7 percent by April 2020, and descends to 3.4 percent by January 2023.
Sources: Visa Business and Economic Insights, U.S. Department of Labor, and Challenger, Grey & Christmas

Footnotes

  1. Visa Business and Economic Insights and U.S. Department of Commerce
  2. Visa Business and Economic Insights and U.S. Department of Labor
  3. Visa Business and Economic Insights and U.S. Social Security Administration
  4. Visa Business and Economic Insights and VisaNet
  5. Visa Business and Economic Insights and Federal Reserve Board
  6. Visa Business and Economic Insights and Challenger, Gray & Christmas

Forward-Looking Statements

This report may contain forward-looking statements within the meaning of the U.S. Private Securities Litigation Reform Act of 1995. These statements are generally identified by words such as “outlook”, “forecast”, “projected”, “could”, “expects”, “will” and other similar expressions. Examples of such forward-looking statements include, but are not limited to, statement we make about Visa’s business, economic outlooks, population expansion and analyses. All statements other than statements of historical fact could be forward-looking statements, which speak only as of the date they are made, are not guarantees of future performance and are subject to certain risks, uncertainties and other factors, many of which are beyond our control and are difficult to predict. We describe risks and uncertainties that could cause actual results to differ materially from those expressed in, or implied by, any of these forward-looking statements in our filings with the SEC. Except as required by law, we do not intend to update or revise any forward-looking statements as a result of new information, future events or otherwise.

Disclaimer

The views, opinions, and/or estimates, as the case may be (“views”), expressed herein are those of the Visa Business and Economic Insights team and do not necessarily reflect those of Visa executive management or other Visa employees and affiliates. This presentation and content, including estimated economic forecasts, statistics, and indexes are intended for informational purposes only and should not be relied upon for operational, marketing, legal, technical, tax, financial or other advice and do not in any way reflect actual or forecasted Visa operational or financial performance. Visa neither makes any warranty or representation as to the completeness or accuracy of the views contained herein, nor assumes any liability or responsibility that may result from reliance on such views. These views are often based on current market conditions and are subject to change without notice.


Visa’s team of economists provide business and economic insights with up-to-date analysis on the latest trends in consumer spending and payments. Sign up today to receive their regular updates automatically via email.