Singapore consumers keen to splurge on travel despite high costs

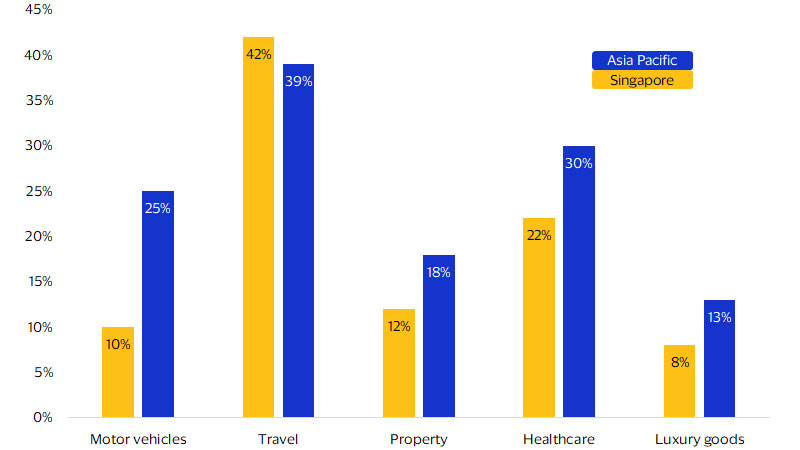
October 2024 – Travel is a favourite big-ticket item among Singapore consumers, according to a recent Visa survey.¹ An impressive 42 percent are likely to splurge on trips in the second half of 2024, making travel the top major spending category (see figure below). One tailwind is the quick recovery of Singapore’s flight capacity, which as of September 2024 had outpaced that of its Southeast Asian neighbours.²
Singapore’s high cost of living, however, is clashing with these jet-setting ambitions and prompting changes in consumer behavior. In the same survey, a net weighted balance of 15 percent of consumers said they expect their incomes to improve next year, far lower than the Asia Pacific region’s average of 32 percent. Our research shows that:
- Singapore consumers are substituting domestic spend with overseas spend in the food and beverage and retail verticals.
- Even abroad, consumers are trading down to cheaper alternatives.
- Malaysian cities are gaining popularity, in part due to lower costs.
Consumers in Singapore are more likely to spend on travel
Share of consumers who are likely to purchase big-ticket items in the second half of 2024, by category
Consumers are adjusting their consumption patterns to afford travel
It’s no secret that many Singapore consumers are foodies, and an increasing share of their culinary adventures are in international locales. According to our data, in-person card spend* at fast food and dine-in restaurants outside of Singapore showed consistently stronger recovery rates compared to other spending categories. In year-on-year (YoY) terms, these segments grew faster than Singapore cardholders’ overall cross-border spend in Q2-2024 (see fig. 2 of full report).
In light of economic uncertainties and rising costs, Singapore consumers have made some lifestyle changes to prioritise travel. First, Singapore consumers are reducing their spend on restaurants and retail domestically in order to fund their spending abroad. While in-person domestic card spending levels on restaurants and retail recovered from Q2-2019 levels, they experienced negative YoY growth in Q2-2024 (see fig. 3 of full report). By contrast, cross-border retail and restaurant spend saw a more robust recovery and strong YoY growth in Q2-2024.
Second, Singapore consumers are trading down to cheaper alternatives overseas. This behaviour is also exhibited by other Asia Pacific travellers such as Thai consumers. While Singapore consumers enjoy eating out abroad, the YoY growth rates for cross-border transaction counts and spend were both higher for the fast food segment compared to the restaurant segment in Q2-2024 (see fig. 2 of full report). This was observed in the preceding quarter as well. Cost pressures are one possible reason: Singapore consumers select cheaper alternatives such as quick-service restaurants instead of restaurants overseas to keep within their tight budgets. Travelling abroad seems to be non-negotiable for many Singapore consumers, but they are changing where they go and what they spend on.
*In-person spend on Visa-branded consumer cards issued in Singapore.
Cities in Malaysia are gaining popularity
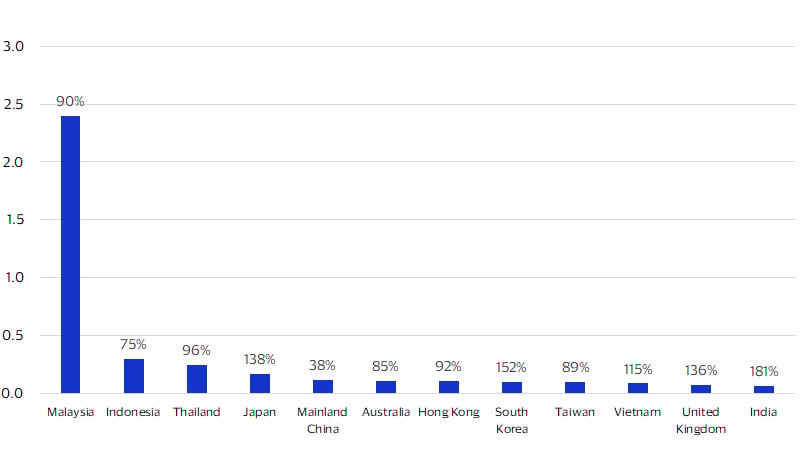
With high inflation and interest rates, consumers in Singapore have adapted in order to satisfy their wanderlust. One way is to travel to nearby destinations or places with a lower cost-of-living. According to Visa’s International Travel platform, the top 10 visited countries in Q2-2024 from Singapore are all within Asia Pacific (see figure below). Malaysia is the top destination for Singapore consumers partly because of its close proximity and the comparatively weak Ringgit. As a result, Malaysia’s share of cross-border in-person card spend from Singapore grew by at least 4 percentage points in Q2-2024 from Q2-2019. Japan, another key destination for Singapore consumers with a relatively weaker currency, rebounded by 138 percent of its 2019 levels in Q2-2024.
In Q2-2019, five Malaysian cities made Singapore’s top 10 most-visited destinations. In Q2-2024, the number grew to seven (refer to fig. 5 of full report). Of particular note are the emergence of nature-based destinations, with Cameron Highlands and Kota Tinggi as new additions to the top 10 list, with the former experiencing close to 300 percent growth in Q2-2024 compared to Q2-2019 levels. Bali, a popular beach destination, also moved up the ranks and saw a full travel recovery in Q2-2024 as flight capacities increased in tandem with higher demand.
Asia Pacific is a key regional destination for Singapore consumers
Footnotes
- Visa Green Shoots Radar Survey (Wave 14). June 2024
- OAG. (2024). South East Asia aviation market data. Retrieved from https://www.oag.com/south-east-asia-aviation-flight-data
Forward-Looking Statements
This report may contain forward-looking statements within the meaning of the U.S. Private Securities Litigation Reform Act of 1995. These statements are generally identified by words such as “outlook”, “forecast”, “projected”, “could”, “expects”, “will” and other similar expressions. Examples of such forward-looking statements include, but are not limited to, statements we make about Visa’s business, economic outlooks, population expansion and analyses. All statements other than statements of historical fact could be forward-looking statements, which speak only as of the date they are made, are not guarantees of future performance and are subject to certain risks, uncertainties and other factors, many of which are beyond our control and are difficult to predict. We describe risks and uncertainties that could cause actual results to differ materially from those expressed in, or implied by, any of these forward-looking statements in our filings with the SEC. Except as required by law, we do not intend to update or revise any forward-looking statements as a result of new information, future events or otherwise.
Disclaimers
The views, opinions, and/or estimates, as the case may be (“views”), expressed herein are those of the Visa Business and Economic Insights team and do not necessarily reflect those of Visa executive management or other Visa employees and affiliates. This presentation and content, including estimated economic forecasts, statistics, and indexes are intended for informational purposes only and should not be relied upon for operational, marketing, legal, technical, tax, financial or other advice and do not in any way reflect actual or forecasted Visa operational or financial performance. Visa neither makes any warranty or representation as to the completeness or accuracy of the views contained herein, nor assumes any liability or responsibility that may result from reliance on such views. These views are often based on current market conditions and are subject to change without notice.
Visa’s team of economists provide business and economic insights with up-to-date analysis on the latest trends in consumer spending and payments. Sign up today to receive their regular updates automatically via email.