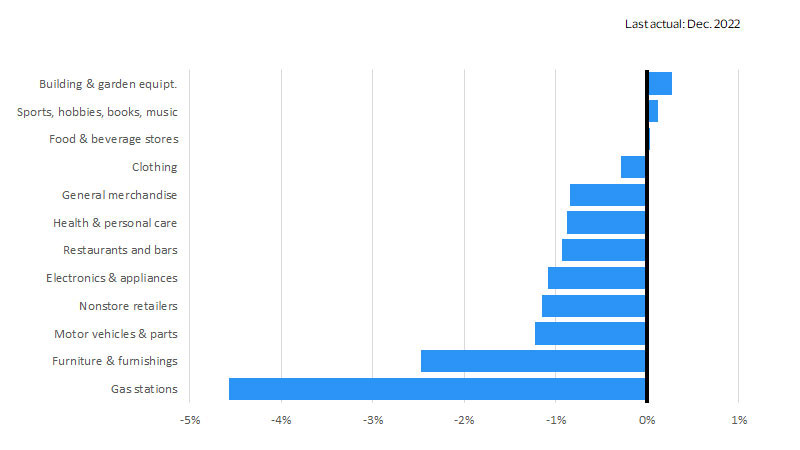
January 2023 – Signs of strength dotted the consumer landscape in early 2022. The economy had largely reopened and the economic impacts of the Omicron variant were fading fast. Sales surged at restaurants and bars as Americans entered the “year of getting on with life,” and clothing sales hit new records as employees headed back to the office.¹ But a lot has changed since then, and 2022 ended with considerable consumer strain. Adjusted for seasonality, total retail sales declined by 1.1 percent between November and December, the largest drawdown all year.² Spending decreased sharply at gas stations due to a sizeable drop in gas prices and an even bigger fall in demand. Consumers purchased less furniture as the housing market faltered and fewer cars as interest rates increased. Severe winter weather had an impact, with a bomb cyclone keeping people off the roads and away from stores, but online shopping declined by approximately $1 million in December, suggesting that the broad-based weakness in December retail sales wasn’t just due to the snowfall and wind chill.
U.S. Monthly Consumer Monitor January 2023

Fig. 1: Retail sales by type of establishment (Seasonally adjusted, month-over-month percent change)
Holiday sales recap
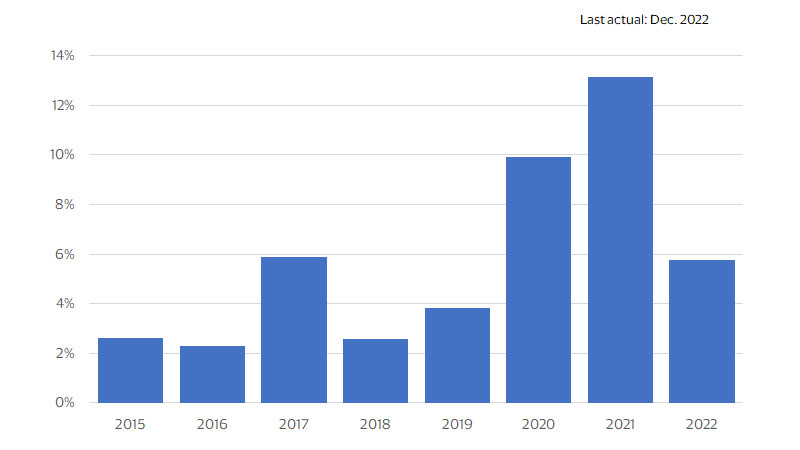
Compared to 2021, holiday sales increased by 5.7 percent year-over-year (YoY) in 2022.³ In most situations, this would signal strong gains from a thriving consumer base. But in the current economic climate, such a result is decidedly mediocre. During the 12 months ending in December, consumer price inflation was 6.4 percent,⁴ indicating that inflation-adjusted holiday sales actually declined. Activity in some gift-heavy categories was abysmal, particularly electronics and appliance stores, where spending shrank by 5 percent YoY even before adjusting for inflation.⁵ Holiday spending was likely pulled forward into October as retailers offered early incentives to unload excess inventory and kick-start the shopping season, and this shift probably skewed the official holiday numbers downward. The primary bright spot was nonstore retail (primarily e-commerce firms), which saw sales increases of 11.6 percent.
Fig. 2: U.S. holiday retail spending (Retail sales excluding autos, gas and restaurants; YoY percent change)
Retail momentum is fading fast
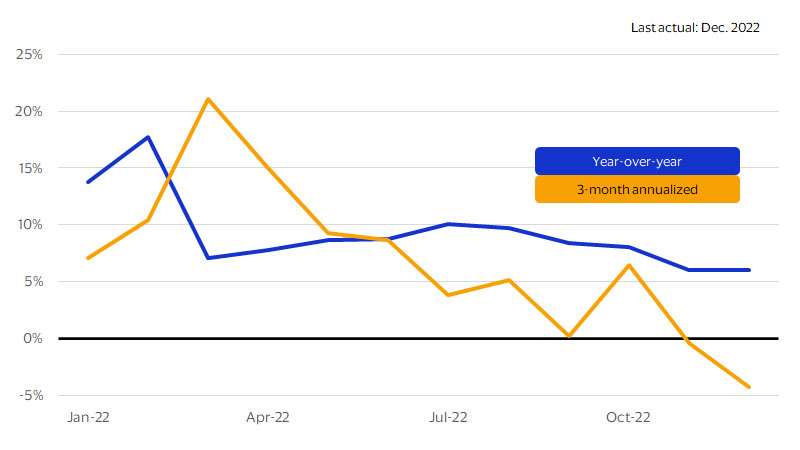
On a YoY basis, total retail spending has also been mediocre. In December 2022, the dollar value of retail sales increased by 6 percent YoY⁶ (shown in the dark blue line in figure 3), which indicates virtually no growth after adjusting for consumer price increases. This is a concerning macroeconomic development, since consumer activity accounts for a large share of the overall economy.⁷ Even more concerning is the recent momentum in retail sales. Over the last three months of 2022, retail sales declined at a 4.3 percent annualized rate (shown in orange in figure 3), indicating serious weakness heading into 2023. The odds of recession are very high, consumers have spent most of the excess savings they accumulated during the pandemic,⁸ and layoff announcements are piling up.⁹ If the economy falls into recession, we would expect retail sales, and consumer spending more broadly, to weaken further.
Fig. 3: Total retail sales (Percent change)
Footnotes
- ¹⁻³ Visa Business and Economic Insights and U.S. Department of Commerce
- ⁴ Visa Business and Economic Insights and U.S. Department of Labor
- ⁵⁻⁷ Visa Business and Economic Insights and U.S. Department of Commerce
- ⁸ Visa Business and Economic Insights, U.S. Department of Commerce, and the Federal Reserve Board
- ⁹ Visa Business and Economic Insights and Challenger, Gray and Christmas
Forward-Looking Statements
This report may contain forward-looking statements within the meaning of the U.S. Private Securities Litigation Reform Art of 1995. These statements are generally identified by words such as “outlook”, “forecast”, “projected”, “could”, “expects”, “will” and other similar expressions. Examples of such forward-looking statements include, but are not limited to, statement we make about Visa’s business, economic outlooks, population expansion and analyses. All statements other than statements of historical fact could be forward-looking statements, which speak only as of the date they are made, are not guarantees of future performance and are subject to certain risks, uncertainties and other factors, many of which are beyond our control and are difficult to predict. We describe risks and uncertainties that could cause actual results to differ materially from those expressed in, or implied by, any of these forward-looking statements in our filings with the SEC. Expect as required by law, we do not intend to update or revise any forward-looking statements as a result of new information, future events or otherwise.
Disclaimer
The views, opinions, and/or estimates, as the case may be (“views”), expressed herein are those of the Visa Business and Economic Insights team and do not necessarily reflect those of Visa executive management or other Visa employees and affiliates. This presentation and content, including estimated economic forecasts, statistics, and indexes are intended for informational purposes only and should not be relied upon for operational, marketing, legal, technical, tax, financial or other advice and do not in any way reflect actual or forecasted Visa operational or financial performance. Visa neither makes any warranty or representation as to the completeness or accuracy of the views contained herein, nor assumes any liability or responsibility that may result from reliance on such views. These views are often based on current market conditions and are subject to change without notice.
Visa’s team of economists provide business and economic insights with up-to-date analysis on the latest trends in consumer spending and payments. Sign up today to receive their regular updates automatically via email.