Economic outlook and forecasts Oil shock ripples through LAC economies and payments
June 2026 – Oil is back in the headlines, and for Latin America and the Caribbean (LAC), that’s not just a macro story; it’s also a payments story. When oil prices jump because the world economy is growing faster, the region can often ride the wave. But when the jump comes from supply disruptions (think geopolitical conflict, shipping chokepoints like the Strait of Hormuz, and higher risk premiums), the usual result is a rough mix of higher inflation and softer growth with some of the effects only felt months after the initial shock.
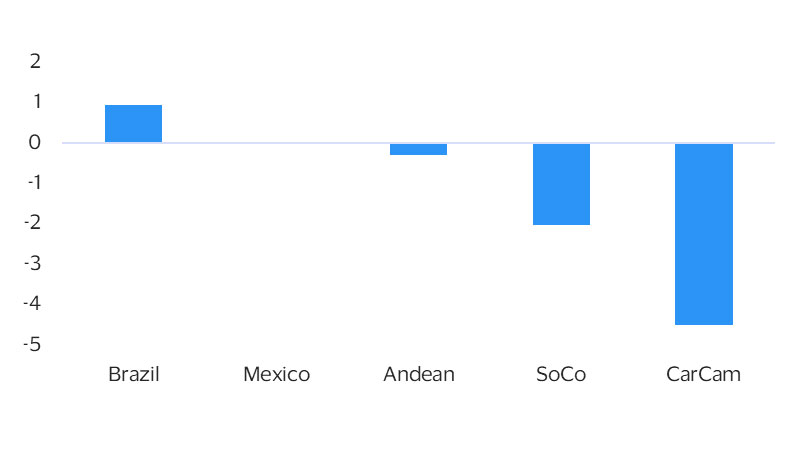
Overall, we project that this shock should reduce GDP growth in the 10 largest LAC economies by an average of 0.2 percentage points (ppts) and push inflation up by 0.4 ppts. Forecast revisions are asymmetric, reflecting the different degrees of local vulnerabilities. Central America and the Caribbean may be potentially more vulnerable because they import most of their fuel and have limited buffers. Mexico, an oil producer as well as a net importer of refined fuels, presents a complicated middle case. Meanwhile, South America is more insulated but not immune.
For the payments industry, this matters because oil shocks don’t just move the consumer price index, they reshuffle how people pay and what they buy. Expect pressure on discretionary spend and a tilt toward essentials, more volatility in cross-border volumes and FX-linked flows, and a bigger role for digital payments where governments lean on targeted transfers or subsidy redesigns.
The takeaway is that headline regional GDP can hide huge divergence in payments growth by subregion and category. Our mid-year outlook unpacks the transmission channels for energy shocks, where growth constraints are most likely to show up, and which indicators payments teams should watch as the shock evolves.
High oil prices, uneven economic and payments impact
Supply-driven energy shocks may raise inflation unevenly and slow economic growth
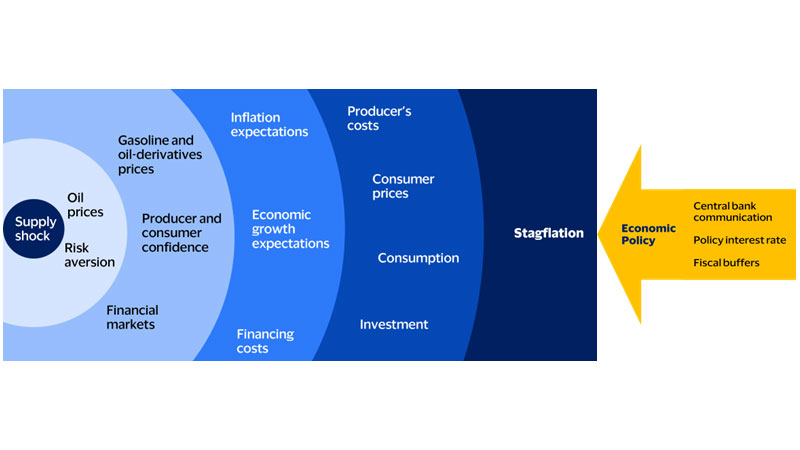
Global oil prices have surged before, but what’s important about this instance is that it’s largely explained by supply disruptions rather than strong global growth. Geopolitical tensions in the Middle East and associated disruptions to energy infrastructure, along with constraints on key shipping routes, have made oil harder and riskier to supply, pushing prices higher. History shows that this type of oil shock tends to raise inflation while weighing on growth, especially in emerging markets. Higher energy costs quickly feed into transportation, electricity, and everyday prices, squeezing household purchasing power and raising costs for businesses.
As a result, consumption often weakens, investment slows, and financial conditions tighten. While uncertainty remains around how long geopolitical tensions will last, the economic pattern is well understood: inflation pressures rise faster than growth, and the effects tend to be uneven across countries depending on energy dependence and policy buffers. For payments, this means slower and more uneven growth, pressure on discretionary spending categories, and greater volatility across markets, not because demand is overheating, but because higher energy costs are acting like a tax on everyday economic activity. The impact is likely to be gradual and uneven. Nominal payment volumes may initially rise with higher prices, but real volumes could soften over time as consumers adjust spending to weaker purchasing power.
How vulnerable is the region?
During 2026, Latin America and the Caribbean face a challenging macroeconomic environment, marked by a renewed increase in oil prices. This episode follows a strong close to 2025 and early 2026, when the global economy proved more resilient than expected before being disrupted by geopolitical events in late February. So far, the impact on LAC as a whole has been moderate and mainly concentrated in fuel-related prices and spending. Nevertheless, there are significant differences across countries and subregions. These differences are critical for understanding what lies ahead for payments.
Central America and the Caribbean are the most exposed, as they rely heavily on imported fuels (see figure below). Higher energy prices act as an immediate “tax” on income, squeezing consumer spending and affecting categories tied to everyday consumption. Governments in this subregion are constrained in how they cushion the shock—after years of post‑pandemic support and rising financing costs, fiscal buffers in these countries are already stretched thin, making broad energy subsidies unlikely. In contrast, countries in the Andean subregion are more insulated, while dependence on fuel imports is higher in the Southern Cone (less Brazil).
Fuel trade balance (exports - imports)
Percent of GDP, regional median (Last actual: 2025)
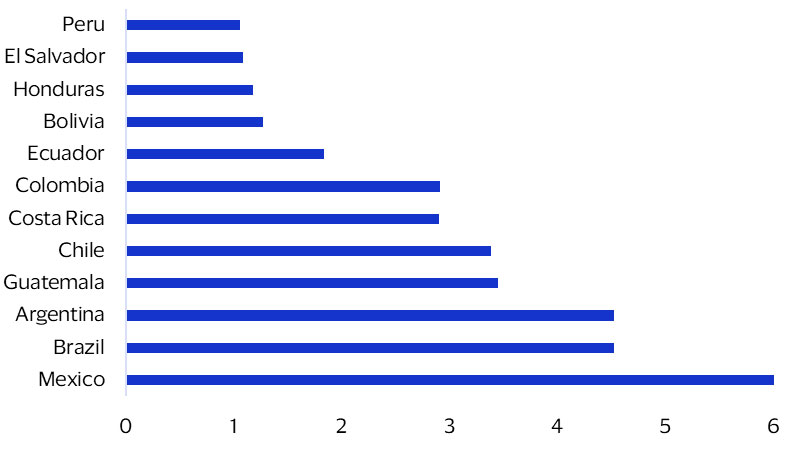
Weight of fuel in the Consumer Price Index (CPI)
Percent of total CPI
Oil shocks are reshaping payment patterns
Higher energy costs shift spending, drive uneven payments growth
From a payments perspective, an oil price shock can disrupt both how much money people spend and how they spend it. In periods of supply‑driven price increases, households typically adjust discretionary spending more quickly and flexibly than spending on essentials (non‑discretionary spending). While higher oil and fuel prices are already reflected in recent inflation data globally, evidence of a pullback in spending remains uneven.
A timely look at early spending effects
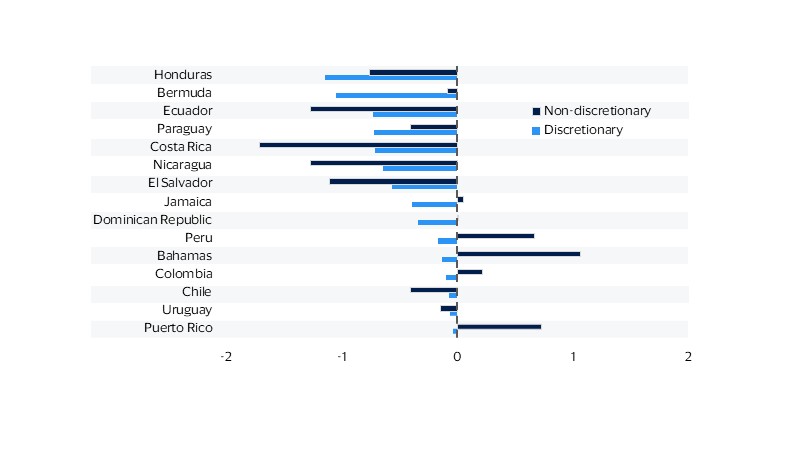
Our proprietary Spending Momentum Index (SMI), which tracks whether more consumers are increasing or reducing their spending based on depersonalized and aggregated Visa transaction data, suggests that early impacts, concentrated in higher fuel prices, began to emerge in March and continued through April. Data for the 26 countries covered by the SMI indicates that local, idiosyncratic factors still dominate, as impact on spending momentum has been diverse and inconsistent. Early indications suggest, though, that the largest downward shifts are concentrated in Central America and the Caribbean, with few exceptions (see figure below).The global oil price shock is still ongoing, which is why further effects may emerge in the region in the coming months. However, it is not surprising that impacts remain uneven, reflecting differences in how exposed each country is to energy price shocks.
Implications for payments
In the coming months, we may see softer momentum in discretionary categories, increased volatility in cross‑border and exchange‑rate‑sensitive flows, and a greater role for digital payments, particularly as governments rely more on targeted support measures to offset the impact on households. These programs are increasingly delivered through electronic payment channels, reinforcing digital adoption. For issuers and acquirers, the key takeaway is that payments growth in 2026 is likely to be more uneven and driven more by each market’s exposure to energy prices than by overall economic growth. Understanding these differences will be critical to anticipating shifts in transaction volumes, spending patterns, and financial flows.
Spending Momentum Index
Standardized monthly change,* index points
Forecasts
Forward-Looking Statements
This report may contain forward-looking statements within the meaning of the U.S. Private Securities Litigation Reform Act of 1995. These statements are generally identified by words such as “outlook”, “forecast”, “projected”, “could”, “expects”, “will” and other similar expressions. Examples of such forward-looking statements include, but are not limited to, statements we make about Visa’s business, economic outlooks, population expansion and analyses. All statements other than statements of historical fact could be forward-looking statements, which speak only as of the date they are made, are not guarantees of future performance and are subject to certain risks, uncertainties and other factors, many of which are beyond our control and are difficult to predict. We describe risks and uncertainties that could cause actual results to differ materially from those expressed in, or implied by, any of these forward-looking statements in our filings with the SEC. Except as required by law, we do not intend to update or revise any forward-looking statements as a result of new information, future events or otherwise.
Disclaimers
The views, opinions, and/or estimates, as the case may be (“views”), expressed herein are those of the Visa Business and Economic Insights team and do not necessarily reflect those of Visa executive management or other Visa employees and affiliates. This presentation and content, including estimated economic forecasts, statistics, and indexes are intended for informational purposes only and should not be relied upon for operational, marketing, legal, technical, tax, financial or other advice and do not in any way reflect actual or forecasted Visa operational or financial performance. Visa neither makes any warranty or representation as to the completeness or accuracy of the views contained herein, nor assumes any liability or responsibility that may result from reliance on such views. These views are often based on current market conditions and are subject to change without notice.
Visa’s team of economists provide business and economic insights with up-to-date analysis on the latest trends in consumer spending and payments. Sign up today to receive their regular updates automatically via email.