For the fun of it: The evolution of leisure spending

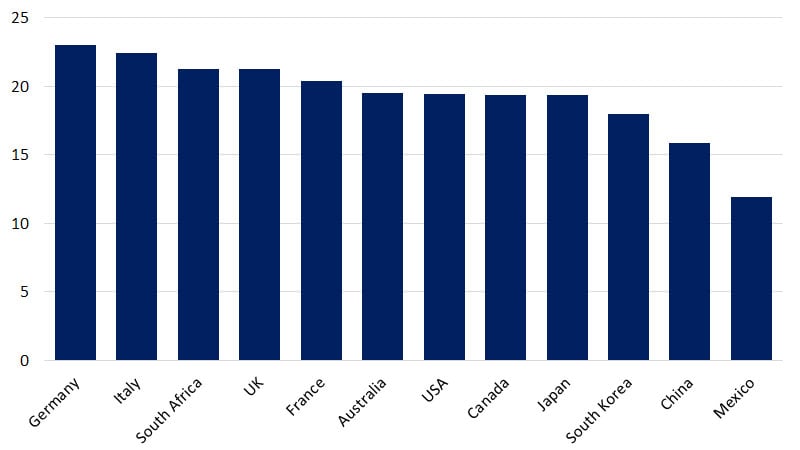
April 2023 – In economic theory, the concept of a labor leisure trade-off suggests that there is some optimal combination of work and play for each of us as individuals. Aggregating individual behavior within Organization for Economic Co-operation and Development (OECD) countries, we see that the share of labor and leisure varies across countries and regions of the world. For example, Germans spend an average of 23 percent of their time on leisure activities while Mexicans spend about 12 percent of their time on such activities—with TV-watching universally being the most popular form of leisure across OECD countries and regions.¹ Counterintuitively, the OECD also found that while productivity increased substantially over the last 50 years, it did not translate into a parallel increase in leisure time.
This would seem to bode poorly for leisure spending. The good news, however, is that the slow decline in leisure time in recent decades appears to have had an inverse effect on leisure spending. In the U.S., for example, leisure time declined by 48 minutes per day from the 1990s to the 2010s, according to the OECD. But since 2013 (and excluding the 2020/2021 pandemic period) there has also been a steady rise in leisure spending as a share of total consumer spending in the U.S., according to our analysis of data from the U.S. Department of Commerce. In 2013, the categories that made up leisure spending accounted for 9.5 percent of total consumer spending and by 2022 rose to 13 percent.²
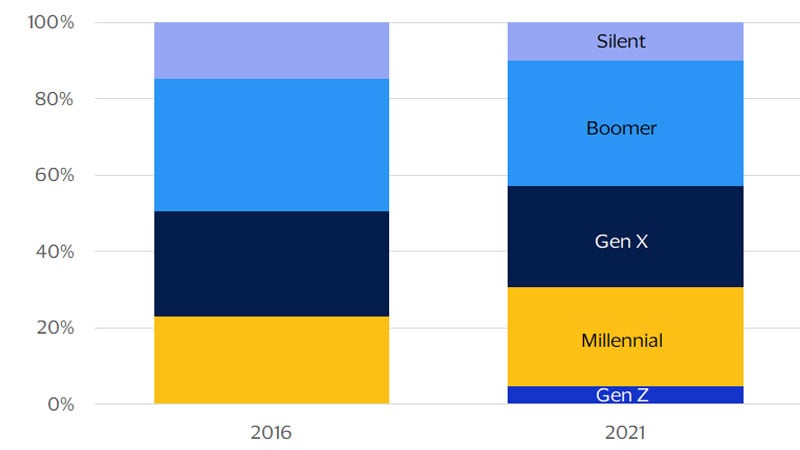
The influence of generational spending has also changed in recent years as the demographics have shifted: Gen Z and millennials’ share of overall consumers rose from 23 percent in 2016 to nearly 31 percent as of 2021. As these younger consumers move toward their peak income-earning years, we expect even further growth in spending related to the leisure categories they prefer most, such as gaming and travel.
Fig. 1: Leisure time varies across countries
Share of time spent on leisure by country
Demographics set to boost travel, gaming spend in the United States: ‘Talkin’ bout my generation’
In the U.S., the amount of time spent on leisure activities remained relatively unchanged over time, apart from 2020 when the pandemic lockdowns occurred.³ However, there have been changes in the types of leisure activities Americans preferred. Outside of watching TV, the second most popular form of leisure was socializing, followed by gaming and computer use.
Gaming and computer use in particular have experienced the fastest growth in leisure time spent since 2015. In recent years, the pandemic led to an overall increase in leisure time in the U.S. and socialization time was replaced, in part, by more gaming. Even following the pandemic lockdowns, in 2021, Americans spent roughly the same amount of time gaming as they did socializing.
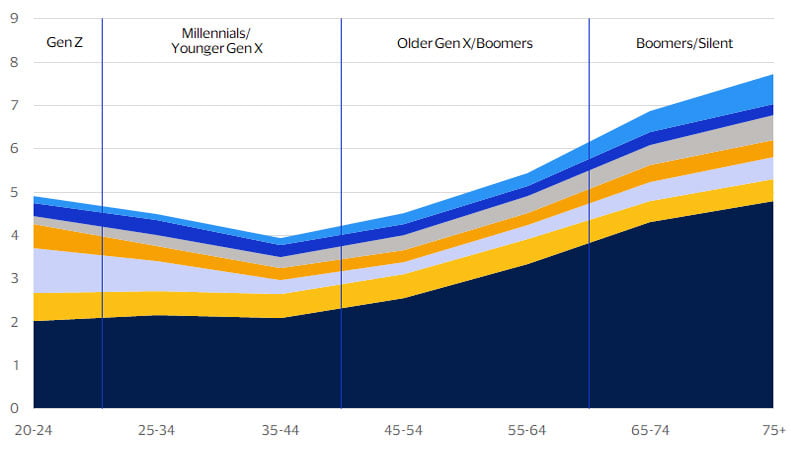
While the average number of hours devoted to gaming and computers has climbed rapidly, there is considerable variation across demographic groups. The youngest generation, Gen Z, spends a little over an hour per day on gaming. Meanwhile, older Gen Xers and boomers spend around half that much time at just 30 minutes on average per day. Among the other key differences across age groups is that Gen Z and millennials spend more of their leisure time traveling than Gen X and boomers. The trend of greater travel among younger consumers existed even before the pandemic.
Given the persistence of these shifts in how Americans choose to spend their leisure time, consumer leisure spending is likely to look different as millennials and Gen Z move into their peak income-earning years.
Fig. 3: TV time has come down to pre-pandemic levels
Time spent per leisure activity (avg. hours per day)
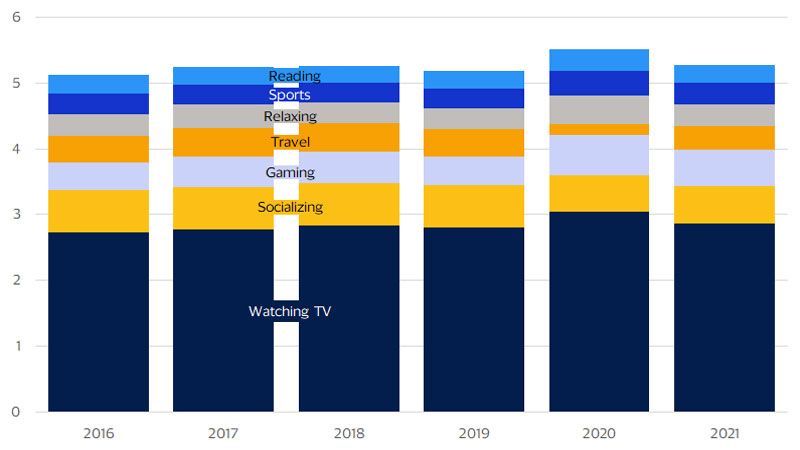
Fig. 4: Preferences for leisure vary by age
Time spent on leisure by age and activity (2021, avg. hours per day)
Generational trends hint at future leisure spending shifts
Leisure spending has outpaced the overall growth in consumer spending over the last decade. In inflation-adjusted terms, spending on leisure activities as a share of overall consumer spending has increased from 9.5 percent to nearly 13 percent.
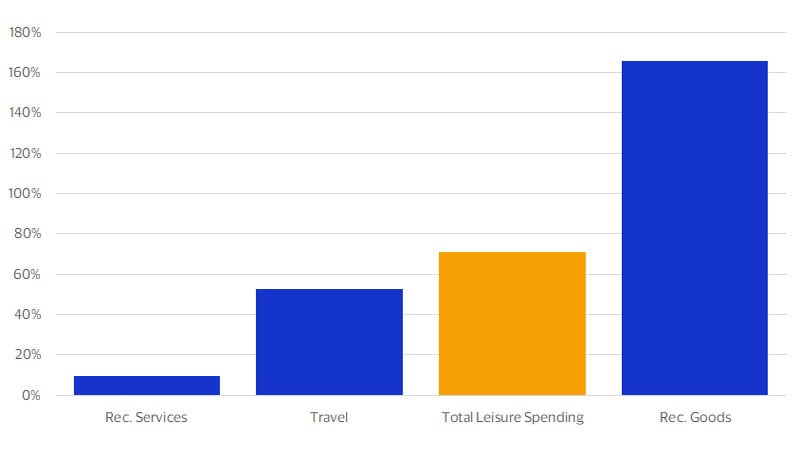
Most notably, spending on recreation goods, which includes items related to TV viewing and gaming, surged 165 percent over the last decade. Travel spending has also surged over the last 10 years, rising an impressive 71 percent. Such pronounced changes are due, in part, to shifting leisure preferences across generations.
Fig. 5: Consumers are spending more on leisure
Real leisure spending* as a share of consumption (2012 dollars, annual avg.)
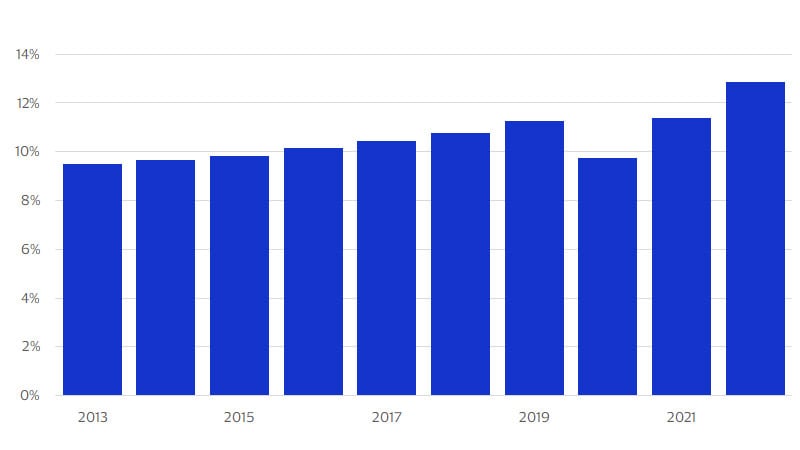
Fig. 6: Spending on goods associated with TV and gaming has surged
Real spending by leisure category (Percent change from 2013)
In order to examine how changes in leisure preferences are impacting spending across generations, we combined VisaNet data with demographic attributes from TransUnion for three of the largest leisure activities: streaming, travel and gaming.
Given that the cost of each leisure activity varies considerably, in order to get a clear picture of how future spending might shift due to demographic leisure preferences today, our analysis focused on the amount spent on each leisure activity as a share of that generation’s total spending. This lens provides some clues as to how Gen Z and millennials might shift their consumption patterns upon reaching their peak income and spending years.
Watching TV is a leisure activity enjoyed by all generations. Hence, it comes as no surprise that streaming is popular across age groups, as evidenced from their share of spend on streaming. Streaming spend breakdown by both age and income shows that the non-affluent in each generation spent more on streaming than their affluent counterparts.⁴ One possible suggestion is that as income increases, other forms of leisure, such as travel, become more obtainable.
While younger consumers may be spending more of their leisure time traveling, their share of spending varies. When looking at Gen Z specifically, 8.83 percent of their total spending goes to travel, which is still substantial for a generation that has not reached its prime spending years but lags behind millennials at 10.42 percent. For travel spend by income, across all generations the affluent spent a higher share of their total spend on travel compared to the non-affluent. For Gen X and boomer travelers, their average travel spend per income group is not as close to each other as that of Gen Z and millennials. Hence, the higher their income, the more Gen X and boomer travelers spend on travel.
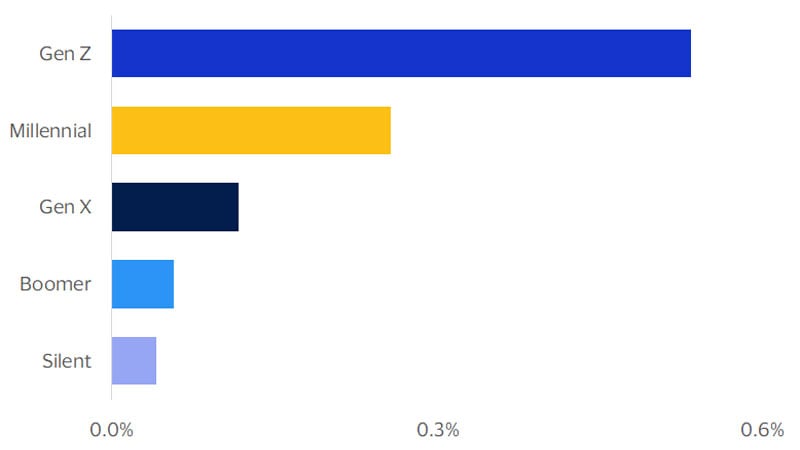
The rapid growth in time spent gaming was not just a U.S. phenomenon. According to Insider Intelligence, time spent on gaming increased post-pandemic for most countries.⁵ Gen Z, the first generation to have grown up online, spends more on gaming relative to other items than other generations. Gen Z spent 0.53 percent of their total spend on gaming followed by millennials at 0.26 percent. While the spend for older generations is small, it is expected to pick up just as social media usage did. The leisure activity of the young generation gives us a glimpse of what the future of consumption could be. Already, we are seeing gamification, a process that incorporates game-design elements or mechanics into existing platforms to increase user engagement. Such trends could help to perpetuate gaming spending going forward.
Combining the longer-term upward trend in leisure spending with the growing share of Gen Z and millennial consumers suggests that the growing categories of gaming and travel should benefit the most in the coming years. Given the sizable preference for TV watching across demographic groups, we expect streaming will likely continue to be a mainstay of leisure spending across generations.
While it is possible that preferences will evolve as these younger consumers age, the impressive growth in both gaming and travel seems to have at least some staying power as these individuals move into their peak income-earning and spending years.
Fig. 7: Streaming is popular across age groups
Streaming spending as a share of total spending by generation
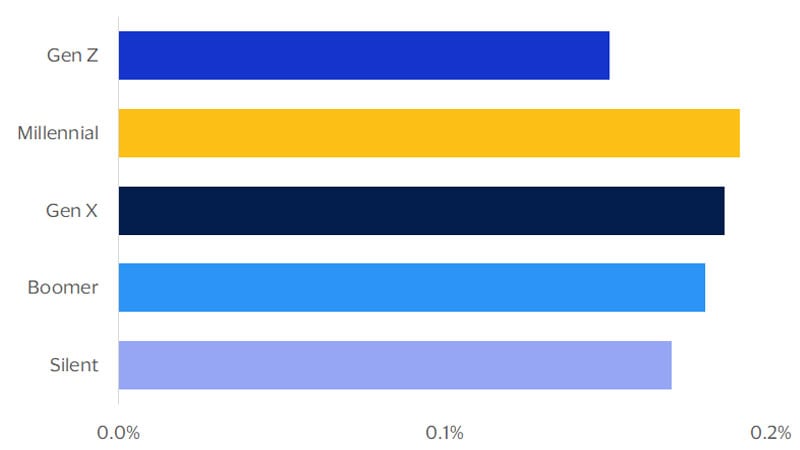
Fig. 8: Young consumers embrace travel before reaching their peak spending years
Travel spending as a share of total spending by generation
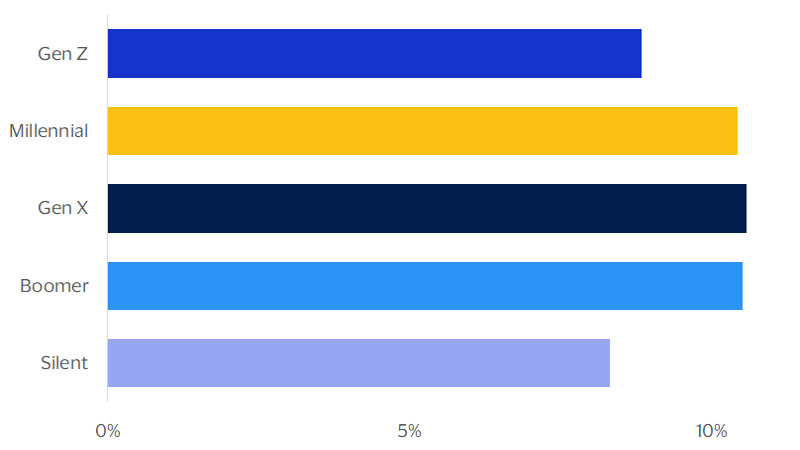
Fig. 9: Gen Z leads in gaming
Gaming spending as a share of total spending by generation
Footnotes
- ¹ Ortiz-Ospina, E. (Dec. 8, 2020). How do people across the world spend their time and what does this tell us about living conditions? Our World in Data. Global Change Data Lab.
- ² We define leisure spending within the U.S. National Income and Product Accounts as the sum of recreational goods and vehicles, recreation services, air transportation, hotels and motels, passenger fares for foreign travel and U.S. travel outside the United States.
- ³ American Time Use Study-2021 Results. (Jun. 23, 2022). U.S. Bureau of Labor Statistics, U.S. Department of Commerce.
- ⁴ We define affluent consumers as those making more than $100,000 in income per year.
- ⁵ Abrams, K. (Oct. 21, 2021). The Global Media Intelligence Report 2021: A Reference Guide to Consumers’ Media Use in 43 Countries. Insider Intelligence. eMarketer.
Forward-Looking Statements
This report may contain forward-looking statements within the meaning of the U.S. Private Securities Litigation Reform Act of 1995. These statements are generally identified by words such as “outlook”, “forecast”, “projected”, “could”, “expects”, “will” and other similar expressions. Examples of such forward-looking statements include, but are not limited to, statement we make about Visa’s business, economic outlooks, population expansion and analyses. All statements other than statements of historical fact could be forward-looking statements, which speak only as of the date they are made, are not guarantees of future performance and are subject to certain risks, uncertainties and other factors, many of which are beyond our control and are difficult to predict. We describe risks and uncertainties that could cause actual results to differ materially from those expressed in, or implied by, any of these forward-looking statements in our filings with the U.S. Securities and Exchange Commission (SEC). Except as required by law, we do not intend to update or revise any forward-looking statements as a result of new information, future events or otherwise.
Disclaimer
The views, opinions, and/or estimates, as the case may be (“views”), expressed herein are those of the Visa Business and Economic Insights team and do not necessarily reflect those of Visa executive management or other Visa employees and affiliates. This presentation and content, including estimated economic forecasts, statistics, and indexes are intended for informational purposes only and should not be relied upon for operational, marketing, legal, technical, tax, financial or other advice and do not in any way reflect actual or forecasted Visa operational or financial performance. Visa neither makes any warranty or representation as to the completeness or accuracy of the views contained herein, nor assumes any liability or responsibility that may result from reliance on such views. These views are often based on current market conditions and are subject to change without notice.
Visa's team of economists provide business and economic insights with up-to-date analysis on the latest trends in consumer spending and payments. Sign up today to receive their regular updates automatically via email.