Economic outlook and forecasts
A slow recovery hides a split in consumer behaviour

Spending Momentum Index
Not seasonally adjusted, index, 3-mma, >100=expansion
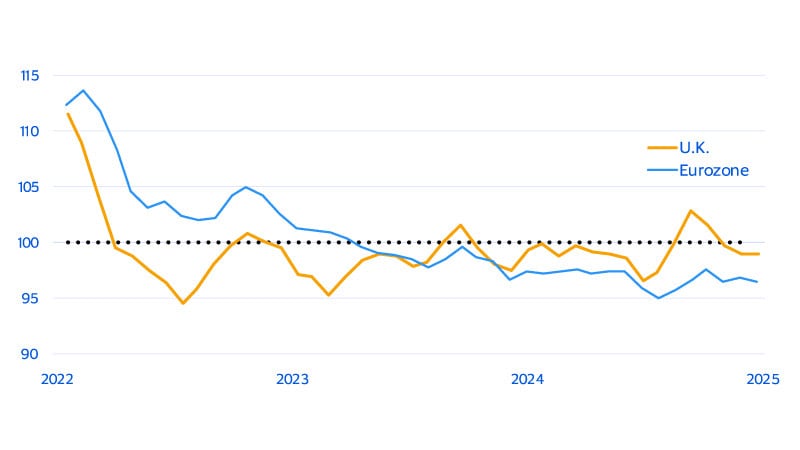
While we expect the differences to play out over the course of 2026, a normalization in consumer spending is still unfolding. Pace varies across countries, and evidence is mixed. Visa’s proprietary Spending Momentum Index (SMI), which tracks consumer spending relative to the previous year, indicates that momentum stalled over the summer after some improvement earlier in the year (see figure above).
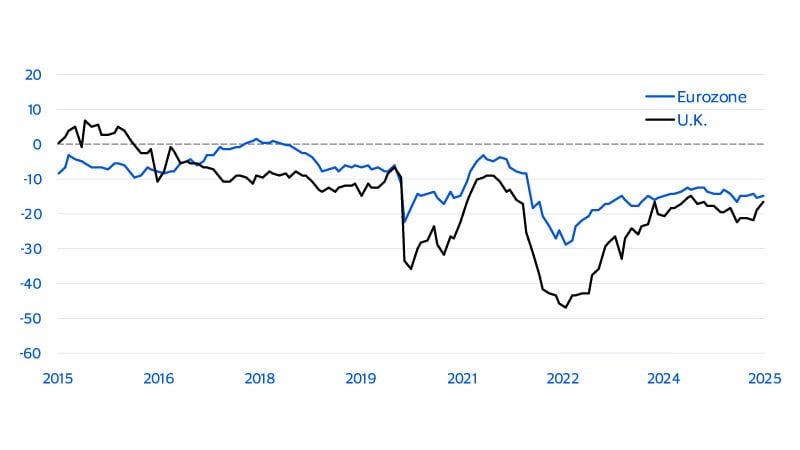
Uncertainty still clouds the outlook,¹ as shown by lacklustre consumer confidence (see figure below). Yet fundamentals remain supportive: the labour market has shown resilience, and wages and salaries continue to grow above their long-term averages, suggesting some gradual repair in purchasing power.
Consumer confidence
Seasonally adjusted, percent balance
On this backdrop, we are encouraged by the relative strength in day-to-day essential spending; meanwhile, spend on discretionary categories continues to lag. It is a story of a glass half-full versus half-empty: jobs and pay-checks make consumers confident enough to re-engage in non-discretionary outlays, but not yet confident enough to do so more broadly. Many households are delaying discretionary purchases, reflecting a preference for financial resilience over increased consumption—in the euro area, the saving rate has steadily risen, and now sits at 15 percent as a share of total disposable income.²
So, it all boils down to a key factor: consumer confidence. Are households willing to spend their real income? Or will they prefer a more guarded stance, where savings are prioritized? Lower inflation should further help restore purchasing power, but lingering uncertainty may weigh in favour of precautionary savings. After a period of restraint, the appetite for non-essentials remains in the balance. Confidence, not just income, will drive the next phase of recovery.
A generation confronts a new reality
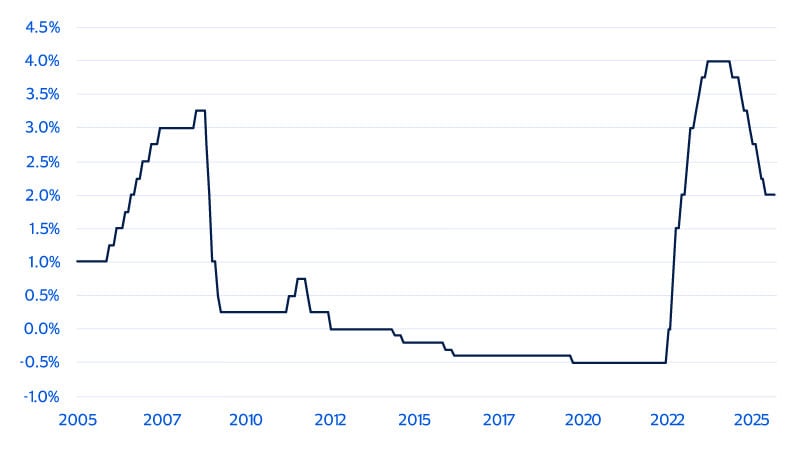
A younger generation meets “older” interest rates
Euro area deposit rate, percent
New trade and energy concerns emerge as headwinds
One of the most immediate concerns facing Europe's economic outlook is the shifting landscape for international trade. With approximately 9-10 percent of euro area exports directed to the U.S. (15 percent in the U.K.’s case and 19 percent for Switzerland), transatlantic trade remains a critical growth engine.³ Recent changes in U.S. trade policy and the potential for new tariffs have introduced fresh uncertainty. Just as European manufacturers are beginning to recover from the energy-driven downturn of 2023 and 2024, new headwinds are emerging that could stall momentum.
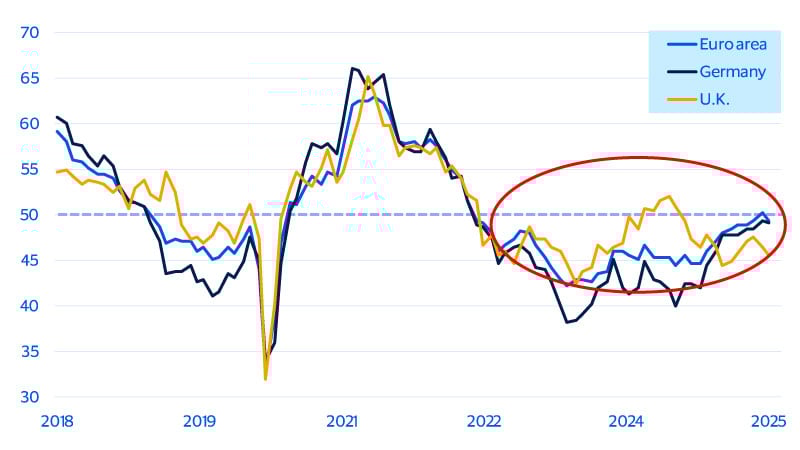
Furthermore, geopolitical tensions, especially along Europe’s eastern borders, continue to inject volatility. Energy costs remain unpredictable despite efforts to diversify away from Russian natural gas. Meanwhile, the EU’s green energy transition has yielded mixed results, adding complexity to an already fragile recovery. These factors collectively weigh on business confidence and investment decisions, especially in sectors highly integrated into global supply chains. Manufacturing, which plays a pivotal role in Europe’s export economy, is one of the sectors most exposed to these risks. While it is not as dominant in employment as it used to be, it still contributes significantly to value added per worker. The recent signs of stabilization in activity are encouraging (see figure below), but the sector remains vulnerable to external shocks and policy shifts.
Manufacturing, a key sector in Europe, is showing signs of stabilization
Manufacturing purchasing managers index (≥50 = expansion)
Final thoughts: Despite challenges, momentum is building
Looking ahead, the outlook for the rest of the year and 2026 remains cautious, and possibly cautiously optimistic. Headwinds are likely to be felt earlier on, with some deceleration in growth expected in the first half of 2026 as supply chains adapt to the new trade realities. Nonetheless, gradual normalization should follow the latter part of the year. By year-end 2026, growth is expected to settle around 1-1.5 percent, a level broadly consistent with Europe’s long-term potential.⁴ With demographic contributions largely flat, future growth will hinge on capital investment and productivity improvements.
Notwithstanding challenges, we should not lose sight of signs of progress. The SMI has improved since the start of 2025, even in countries like Italy, Germany and Greece. Confidence may have temporarily stalled, but it’s not retreating. Even with political uncertainty and economic headwinds, Europe’s economies are working hard to regain their footing. The region continues to navigate a complex landscape of risks, but both consumers and businesses have shown resilience and adaptability over the past few years. The foundations for recovery are in place, and the momentum, though measured, is building.
Footnotes
- European Commission
- Eurostat
- Visa Business and Economic Insights and Oxford Economics
- Visa Business and Economic Insights analysis of Eurostat data
Disclaimer
The views, opinions, and/or estimates, as the case may be (“views”), expressed herein are those of the Visa Business and Economic Insights team and do not necessarily reflect those of Visa executive management or other Visa employees and affiliates. This presentation and content, including estimated economic forecasts, statistics, and indexes are intended for informational purposes only and should not be relied upon for operational, marketing, legal, technical, tax, financial or other advice and do not in any way reflect actual or forecasted Visa operational or financial performance. Visa neither makes any warranty or representation as to the completeness or accuracy of the views contained herein, nor assumes any liability or responsibility that may result from reliance on such views. These views are often based on current market conditions and are subject to change without notice.
Spending Categories
Discretionary (airlines, lodging, auto rental, appliance retail, computer retail, fashion retail, florist, general department store, home goods retail, leisure goods retail, luxury goods retail, repurposed goods retail, sporting goods retail, attractions & amusements, duty free, entertainment, gambling, marina services, sport & recreation, transportation, travel agencies, construction services, electric goods repair, home repair services, personal services, professional services, spa/beauty services, telecommunication, charity, direct marketing, membership clubs).
Non-discretionary (medical/health services, pharmacy, food retail, supermarkets, postal/courier, utilities, education, tolls/fees, wholesale).
SMI Methodology
The Visa Spending Momentum Index (SMI) measures the breadth of year-over-year change in household spending within an economy, including the share of households with increased spending compared with those where spending was stable or declined. The index is generated using proprietary techniques that extract economic signals from business-related noise inherent in VisaNet transaction data, such as portfolio flips, routing changes, or evolving acceptance across geographies or merchant segments. Regional and national aggregates are population-weighted averages.
The resulting sample data is then aggregated using a diffusion index framework in which index values are scored from 0 to 200. Values above 100 indicate broad-based net acceleration in economic momentum. Values below 100 indicate contraction on an annual basis.
Forward-Looking Statements
This report may contain forward-looking statements within the meaning of the U.S. Private Securities Litigation Reform Act of 1995. These statements are generally identified by words such as “outlook”, “forecast”, “projected”, “could”, “expects”, “will” and other similar expressions. Examples of such forward-looking statements include, but are not limited to, statements we make about Visa’s business, economic outlooks, population expansion and analyses. All statements other than statements of historical fact could be forward-looking statements, which speak only as of the date they are made, are not guarantees of future performance and are subject to certain risks, uncertainties and other factors, many of which are beyond our control and are difficult to predict. We describe risks and uncertainties that could cause actual results to differ materially from those expressed in, or implied by, any of these forward-looking statements in our filings with the SEC. Except as required by law, we do not intend to update or revise any forward-looking statements as a result of new information, future events or otherwise.
Visa’s team of economists provide business and economic insights with up-to-date analysis on the latest trends in consumer spending and payments. Sign up today to receive their regular updates automatically via email.