Economic outlook and forecasts 2026: Another precedent-shattering year

June 2026 – At midyear 2026, the global economy faces challenges that feel both familiar and strange. Over the long arc of history, the world has absorbed commodity booms and busts, survived wars and ecological disasters, and faced periods of disruptive innovation. But it may never have endured any of these as synchronized and at the scale and intensity that these stresses are coming today. It certainly has not faced them in a global economy as real-time digitally recorded and analyzed as today’s.
Armed with data and precedents, we expect the global economy to advance modestly in 2026, growing 2.4 percent year-on-year at market exchange rates and constant prices. The world is rapidly embracing artificial intelligence, rebuilding trading relationships, and replenishing armories depleted by recent conflicts and greening energy systems. That upswing in business investment should help to move the economy forward, in turn offsetting the household consumption drag from higher inflation.
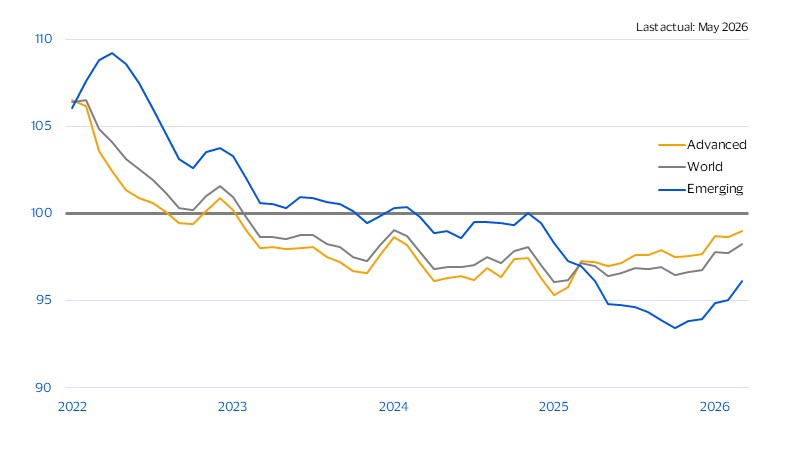
Rising inflation is once again shrinking household budgets and constraining consumer spending growth—more so in some regions than others. If there’s a silver lining, the rise in prices should fall well short of and be less disruptive than earlier in the decade. In 2022, commodity shortages coincided with one of the strongest expansions ever. This time around, the economy is starting from a much softer spot (see figure below), limiting how much inflation can rise. Additionally, a more digitally connected global economy—driven in part by the rapid spread of digital commerce to “peripheral” cities—should help to constrain price increases.
Consumer demand was softer in early 2026 than in 2022
Visa Spending Momentum Index (SMI); 3-month moving average; ≥100 strengthening, <100 weakening
Business investment is rising sharply and powering growth
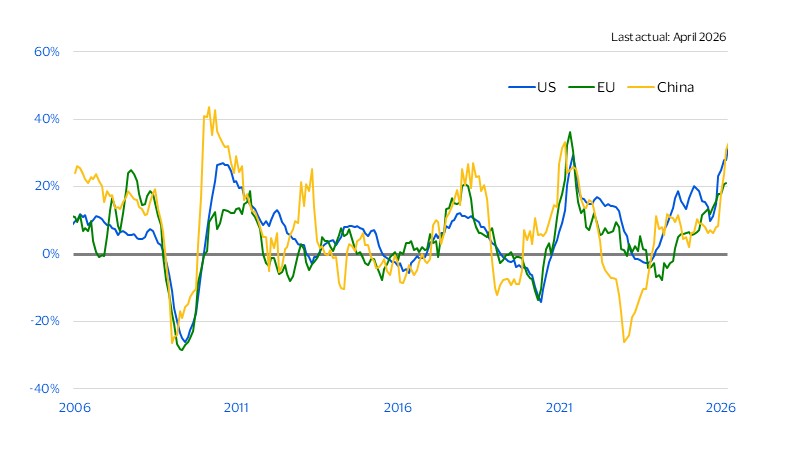
The global economy has entered its strongest industrial upcycle since 2010, excluding the immediate post-pandemic years. This upswing should help maintain the global economy’s forward momentum, even against a more fragile geopolitical backdrop, which has induced increased investment in defense, energy, and technology. Investment in these three sectors has been supercharged by the race to build out and power generative AI and the transition to greener energy. The substantial nature of this upswing can be seen in the strong rise in capital goods imports across the world’s three major economies (the United States, the European Union and China), which collectively account for three-quarters of all global demand (see figure below). These dynamics contribute to faster commercial payments growth as firms adapt on the ground by re-routing suppliers, shortening corridors, and making working-capital decisions earlier in the cycle before geopolitical tensions escalate further.
Synchronized global investment is underway
Capital goods imports (3-month moving average, YoY, percent)
Meanwhile, strong global AI demand will lend support to growth, for now. We’re still early when it comes to unleashing the productive potential of AI. The real productivity step-up from AI will likely come later, as firms first need to make a series of costly but necessary investments: redesigning business processes, fitting new tools into existing workflows, and upskilling workers. These efforts create valuable intangible assets, but measuring the costs and the benefits of this adoption is missed in conventional measures of output. That is why productivity can look flat, or even weaker, in the early stage of adoption. The payoff comes later. Further, the recent surge in hardware spending suggests that a wave of complementary investment in intangibles—non-physical assets like software and patent—is likely to follow.
On a global basis, the rise in business investment should mostly offset the drag from the ongoing energy supply shock. Outlooks for regions or countries have been more varied, with three different channels determining the extent to which downward pressure from the oil shock is felt. First, disruptions to shipping and energy flows raise business costs and directly constrain production, especially in energy-dependent sectors. The biggest strain will fall on economies that are both energy-intensive and heavily reliant on imports from the Middle East. Second, higher energy prices are squeezing household purchasing power and corporate margins. Third, rising inflation and expectations of tighter policy are tightening financial conditions and adding another drag on demand. Markets in South and Southeast Asia, particularly those with weak fiscal buffers, face the greatest shock through multiple channels. South America looks relatively better placed, given its lower reliance on Middle East energy imports.
Energy-driven inflation shock weighs on consumer spending
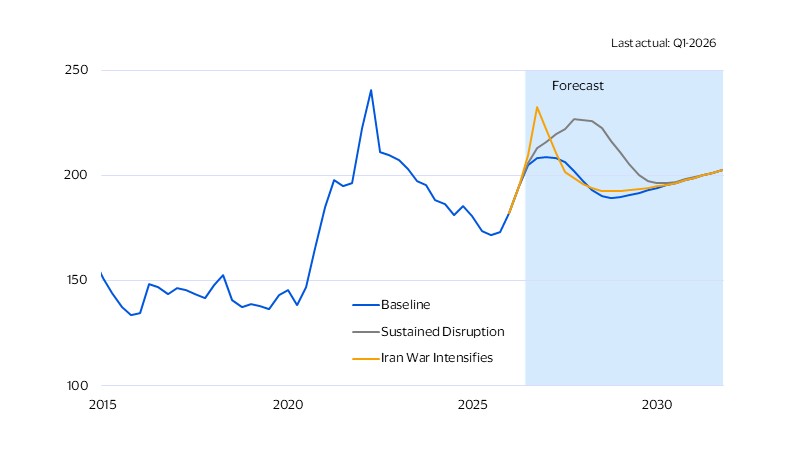
The current energy shock is likely to generate more contained inflationary pressures than in 2022 following Russia’s invasion of Ukraine. Global demand is lower today than in the immediate post-pandemic period, and the current shock has not come with the same direct disruption to the global food supply as in 2022, when exports from major cereal producers Ukraine and Russia were affected. This should help limit the scale of the inflation surge, even if energy and fertilizer prices remain elevated.
That said, the shock is still large enough to matter for households and businesses. Higher fuel costs are already feeding into transportation and other oil-linked prices, while the Middle East’s role in fertilizer exports means food-price pressures are likely to build with a lag rather than all at once. Fertilizer subsidies in many countries may dampen the initial pass-through, but they do not remove the underlying cost pressure. So while inflation is unlikely to match the severity of 2022, it is still likely to weigh on spending. The Visa SMI data already points in that direction: in the U.S., greater energy independence has softened the blow, though higher prices are still starting to pass through. In the Gulf economies, spending pulled back sharply in March but began to normalize in April as tensions eased. Elsewhere, particularly in Asia, Europe, and Latin America, the shock was faster and more pronounced, contributing to higher fuel spending and a broader pullback in demand. What we are seeing so far looks more like adjustment than collapse, particularly with tepid signs of consumer spending firming in May. Meanwhile, the nascent signs of broadening of industrial upswing to jobs have kept discretionary spending relatively stable thus far.
Food prices will rise, with a lag
World food prices (Index, 2005=100)
The spread of digital commerce will constrain inflation
Inflation is not just squeezing demand; it is also changing how consumers respond to higher prices. In a more digital economy, shoppers can compare more easily, switch more quickly, and trade down faster. Visa data shows that markets with higher digital penetration also see greater customer churn, with loyalty falling as the online share of spending rises. Firms will find it challenging to sustain price increases because they weaken customers’ loyalty and repeat purchasing amid a more competitive consumer environment.
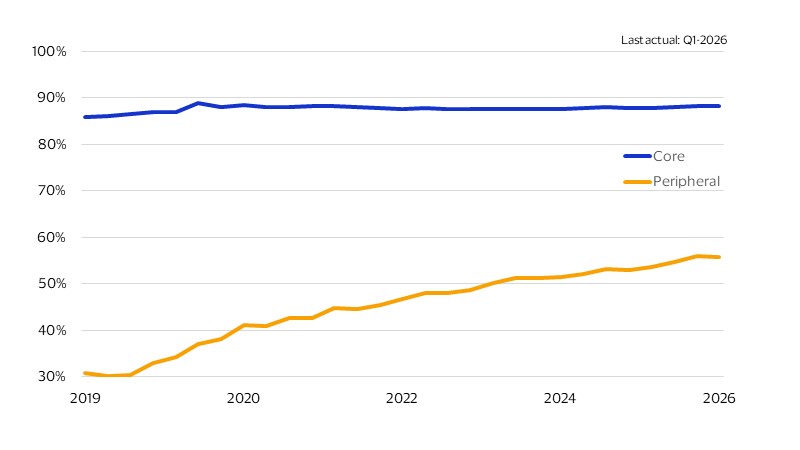
Digital commerce continues to spread to peripheral cities
Average share of cards with card-not-present transactions (percent)
Digital commerce continues to spread to peripheral cities
Average share of cards with card-not-present transactions (percent)
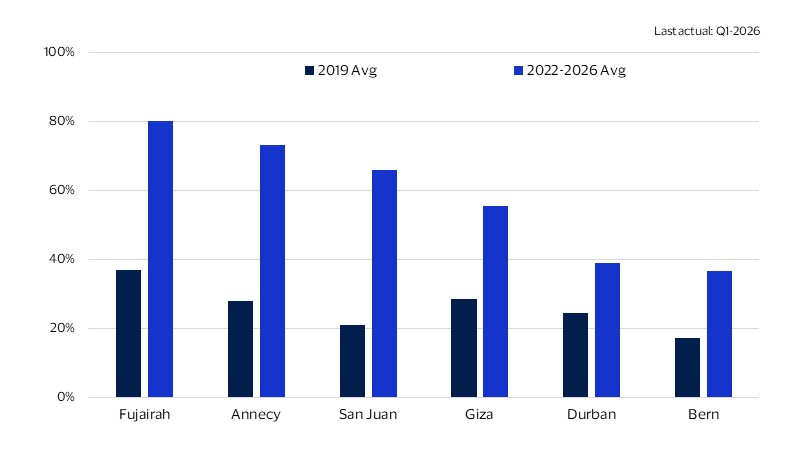
Many of these peripheral cities are not niche markets. They tend to be more densely populated than core cities, even though they have lower internet penetration and were initially less digitally active. In other words, the next wave of digital commerce is reaching places where the consumer base is already there, but digital behavior is still catching up. That broadens the growth opportunity for issuers, merchants, and platforms, while also extending the inflation-constraining effects of digital commerce into more markets.
The spread of digital commerce to peripheral cities is supporting the outlook through two channels at once. First, it supports growth by widening the adoption curve outside the core and deepening digital demand across more cities. Second, it constrains inflation by making online markets more contestable, which reduces customer stickiness and makes it harder for firms to pass higher costs through in full.
Note: Close to 600 cities were classified using their average 2019 card-not-present transaction mix. The top quartile is labeled “core,” the bottom half “peripheral.”
Forward-Looking Statements
This report may contain forward-looking statements within the meaning of the U.S. Private Securities Litigation Reform Act of 1995. These statements are generally identified by words such as “outlook”, “forecast”, “projected”, “could”, “expects”, “will” and other similar expressions. Examples of such forward-looking statements include, but are not limited to, statements we make about Visa’s business, economic outlooks, population expansion and analyses. All statements other than statements of historical fact could be forward-looking statements, which speak only as of the date they are made, are not guarantees of future performance and are subject to certain risks, uncertainties and other factors, many of which are beyond our control and are difficult to predict. We describe risks and uncertainties that could cause actual results to differ materially from those expressed in, or implied by, any of these forward-looking statements in our filings with the SEC. Except as required by law, we do not intend to update or revise any forward-looking statements as a result of new information, future events or otherwise.
Disclaimers
The views, opinions, and/or estimates, as the case may be (“views”), expressed herein are those of the Visa Business and Economic Insights team and do not necessarily reflect those of Visa executive management or other Visa employees and affiliates. This presentation and content, including estimated economic forecasts, statistics, and indexes are intended for informational purposes only and should not be relied upon for operational, marketing, legal, technical, tax, financial or other advice and do not in any way reflect actual or forecasted Visa operational or financial performance. Visa neither makes any warranty or representation as to the completeness or accuracy of the views contained herein, nor assumes any liability or responsibility that may result from reliance on such views. These views are often based on current market conditions and are subject to change without notice.
Visa’s team of economists provide business and economic insights with up-to-date analysis on the latest trends in consumer spending and payments. Sign up today to receive their regular updates automatically via email.