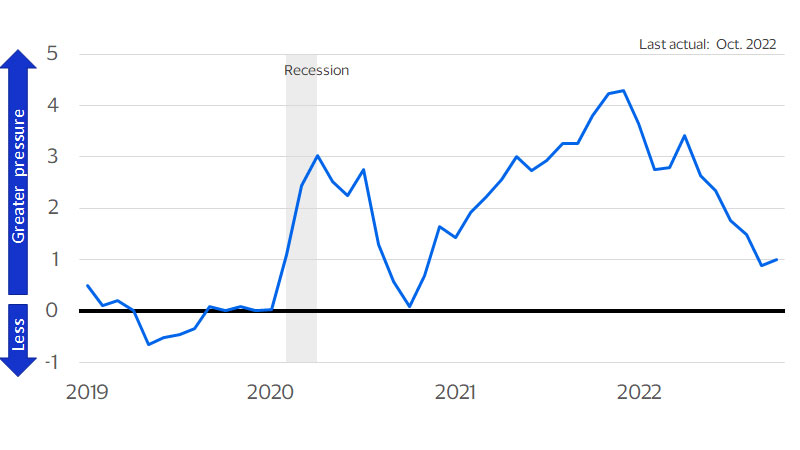
These days, the word “recession” ignites fear in the hearts of many Americans. The last two recessions were exceptionally challenging, inflicting immense hardship on millions of households. They were punctuated by unusual crises—a financial collapse and a global pandemic—that carved deep scars into the fabric of the economy. But these events were highly atypical, and there is no evidence to suggest that the next recession will be as damaging. If anything, the evidence points to something different altogether. The recession of 2023—if it does occur—will likely be triggered by rising interest rates. When rates go up, it becomes more expensive to borrow money, creating headwinds for sectors that rely on loans and investment capital. And rates have certainly gone up. In order to combat inflation, the Federal Reserve has raised the federal funds rate at the fastest pace in decades, leading to steeper borrowing costs on everything from mortgages to business loans.
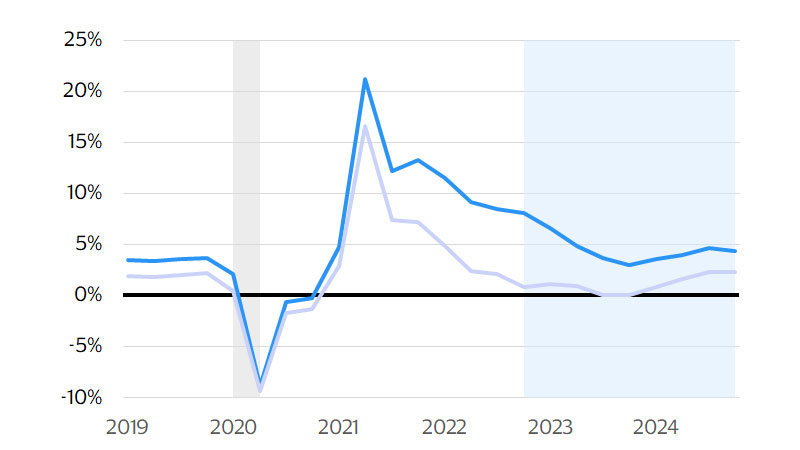
In the past, when recessions have been induced by higher rates, they have often been shallow, brief, and confined to a small number of sectors. A similar scenario is expected in 2023. To start, the recession will likely span only three quarters, making it much shorter than the 18-month recession of 2007-2009. In addition, GDP is expected to decline by less than 2 percent at an annualized rate in each quarter of the next recession. In 2020 it shrank by an almost unfathomable 30 percent. By these two measures—depth and duration—2023 should be much milder than either 2020 or 2007-2009. It should also be less diffuse. It will likely be concentrated in manufacturing, tech and construction, and will be characterized by a substantial decline in business investment, but most other industries could be relatively unscathed. Manufacturing activity almost always declines during recessions, as global trade weakens and saving takes priority over spending. After a voracious growth phase driven by new approaches to working and living, tech firms began announcing layoffs in late 2022, and such cutbacks may escalate in 2023. Tech is heavily dependent on loans and investment capital, with prominent firms relying on outside money for everyday expenses like payroll and rent, making a tech retrenchment highly likely next year.
The construction industry is already in a deep recession, with crews breaking ground on fewer homes, apartments and office buildings than in recent quarters. Lastly, firms of all sizes are expected to scale back their investment plans. As the economy slows and corporate profits diminish, companies will probably become more risk averse, preferring to park their capital in the bond market (which now offers attractive returns—yet another result of higher interest rates) instead of buying new equipment or investing in new software.
As a result of these industry dynamics, the recession should be felt unevenly across the U.S. The West and Midwest will likely experience deeper contractions due to their heavy concentrations in tech, manufacturing and housing. The South and Northeast will also fall into recession but will fare comparatively better as they rely more heavily on tourism, international trade, government and energy. Outside of tech, construction, manufacturing and business investment, the 2023 recession is expected to be mild. Consumer spending, in particular, should perform relatively well. U.S. households have healthy balance sheets and a large amount of savings in the bank. They are still catching up on experiences they missed during the pandemic, and there is a huge amount of pent-up demand for cars. All told, spending growth should slow during the first half of 2023— but will still likely be higher than the previous year—which will be positive news for consumer-facing companies.