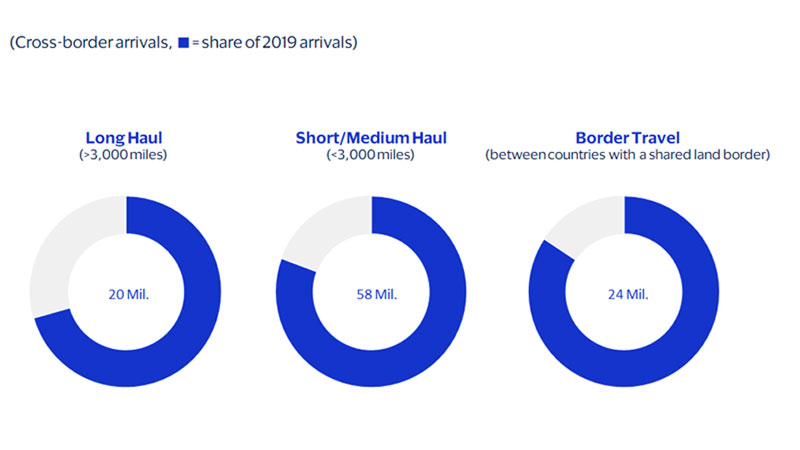
July 2022 – Global travel’s recovery appears to be on an accelerated path forward, with the industry finally leaving the doldrums it was stuck in since early 2020. As of May 2022, cross-border trips globally reached 78 percent of their 2019 levels based on monthly official cross-border arrival data augmented by depersonalized and aggregated transaction data.¹ With long-haul travel (trips of longer than 3,000 miles) now also 71 percent recovered, getting to a full recovery is less about restoring the mix of destinations and more about the strength and openness of source markets.
Pent-up demand and momentum from the current recovery should be enough to sustain a solid summer travel season in the Northern Hemisphere this year. However, rising inflation and slowing economic growth could have an impact, especially on short- and medium-haul travel; less so for long-haul trips.
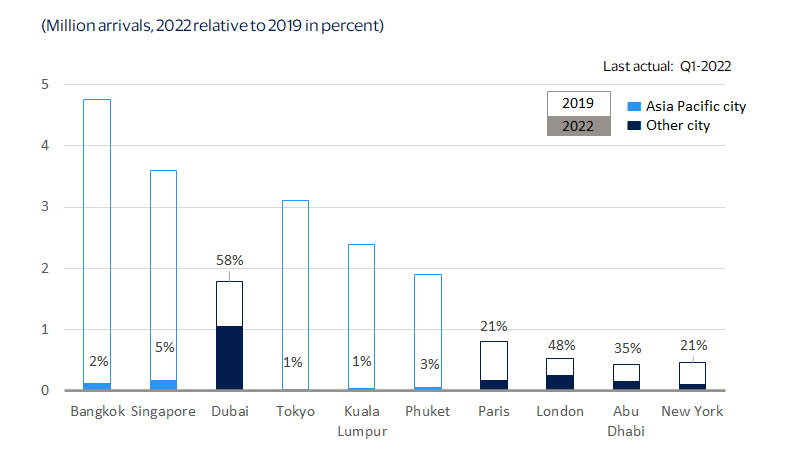
The recovery will not be complete until outbound travel demand in Asia Pacific returns. Recent arrivals data gives reason to be optimistic that the region should soon begin to close the gap with other regions, especially as more Asia Pacific countries re-open to travel.²
Whether global travel can get back to pre-pandemic trends over the long term depends on the strength and growth of outbound travel from China. Even after its zero-COVID policy ends, China’s ability to return to its prior rates of growth and volumes will be increasingly uncertain, given its rapidly aging population and stressed household financial conditions.