Special report: Global Travel Insight Q3-2022

Global travel nears full recovery.

Growing economic cross-currents

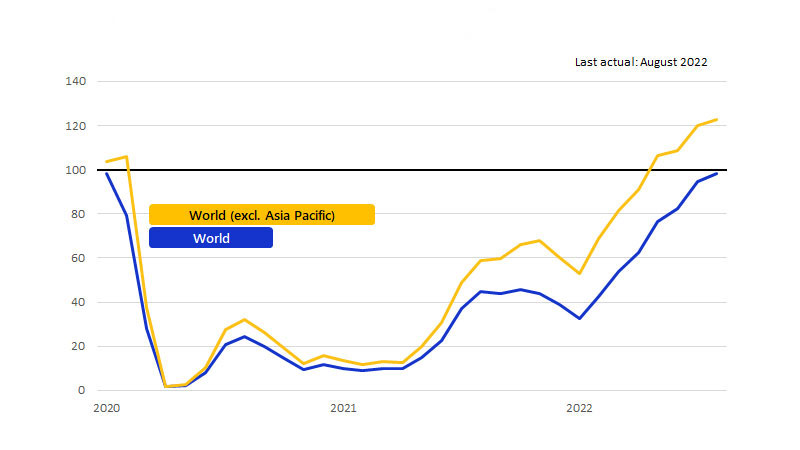
Global cross-border arrivals line chart. See image description for details.

Line chart showing global cross-border arrivals by traveler origin. Indexed to the same month in 2019, global cross-border arrivals reached a record low of 1.5 in April 2020 for all travelers and 1.6 for all travelers excluding those from Asia Pacific. The index of cross-border arrivals slowly moved up to 43.6 for all travelers and 67.8 for all travelers excluding those Asia Pacific in November 2021. As of August 2022, cross-border arrivals for all travelers increased to 97.9 and cross-border arrivals excluding travelers from Asia Pacific rebounded, reaching an index of 122.7.

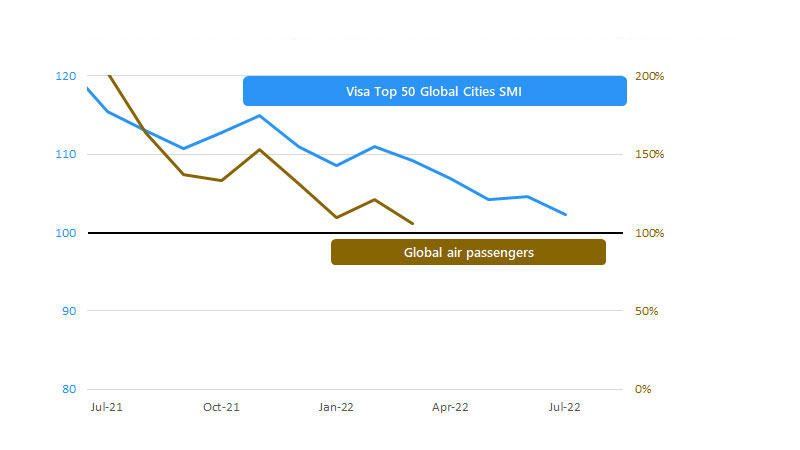
Air travel demand line chart. See image description for more details.

Line chart showing the Visa Spending Momentum Index (SMI) for the top 50 global cities and global air travel demand. In July 2021, the SMI was at 115.4 while air travel demand was at 202%. Both the SMI and air travel demand continue to decline with the SMI reaching  109.1 and air travel demand 106% in March 2022. The SMI for the Top 50 Global Cities has slowed to 102. 2 as of July 2022.

More people on the move aids the return of retail tourism

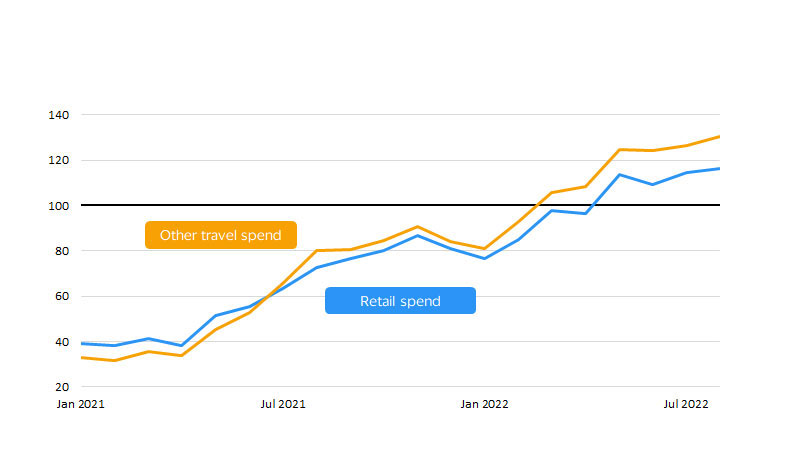
International tourist in person spending abroad line chart. See image description for details.

Line chart showing in person spending by international tourists when abroad. Indexed to the same month in 2019, retail spend reached a low of 39 while other travel spend reached a low of 33 in January 2021, with retail spending outpacing other travel spend. By November 2021, retail travel improved to 87 and other travel spend rose to 91. In August 2022, retail spend reached a high of 116 and other travel spend rose to 130 widening the gap between them as other travel spend outpacing retail spend.

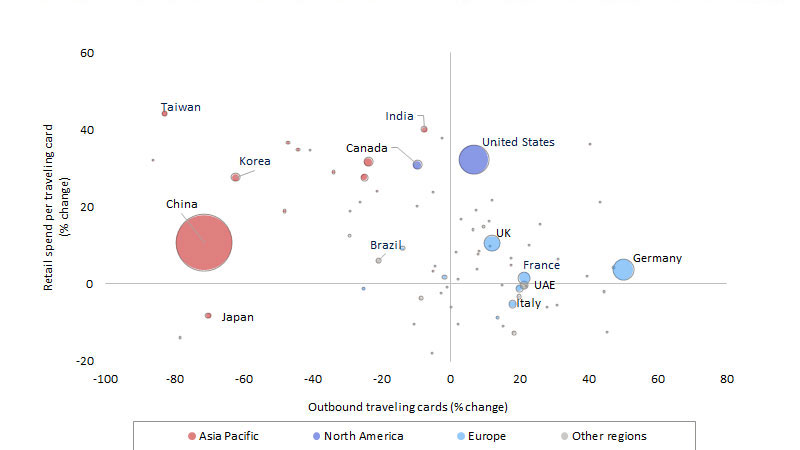
International tourist retail spending bubble chart. See image description for details.

Scatter chart showing in person retail spending by international tourists abroad Jun-Aug 2022 compared to Jun-Aug 2019. Horizontal axis represents percent change in the number of cardholders traveling aboard and the vertical axis represents percent change of retail spend per card. For the US, number of cardholders traveling abroad increased by 7% and their spending per card abroad increased by 32 percent. For Germany, number of cardholders traveling abroad increased by 50% and their spending per card abroad was only 4%. Asia Pacific outbound travel has not recovered, but those who do travel are spending more relative to 2019.

Cross border spend recovery table. 1st column Rank in 2019. 2nd column destination. 3rd column retails spending (2019=100)

Travel trend: Business destinations brimming with tourists

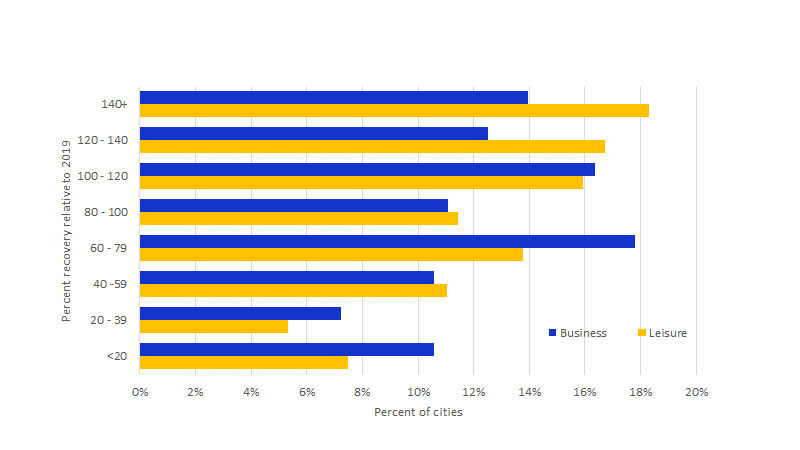
Destinations recovery rate bar graph. See image description for details.

Bar chart showing the distribution of destinations by recovery rate and type, Jan-Sept 2022 compared to Jan-Sept 2019. Destinations that recovered above 140 percent, leisure destinations recovered 18.3 percent and business destinations recovered 13.9 percent. Destinations that recovered 60-79 percent, business destinations recovered 17.7 percent and leisure destinations recovered 13.7 percent. Destinations that recovered less than 20 percent, business destinations recovered 10.5 percent and leisure destinations recovered 7.4 percent.

Column 1: Destinations. Column 2: Americas. Column 3: Europe. Column 4: Middle east and Africa.

Slower business recovery creates opportunity for leisure travel

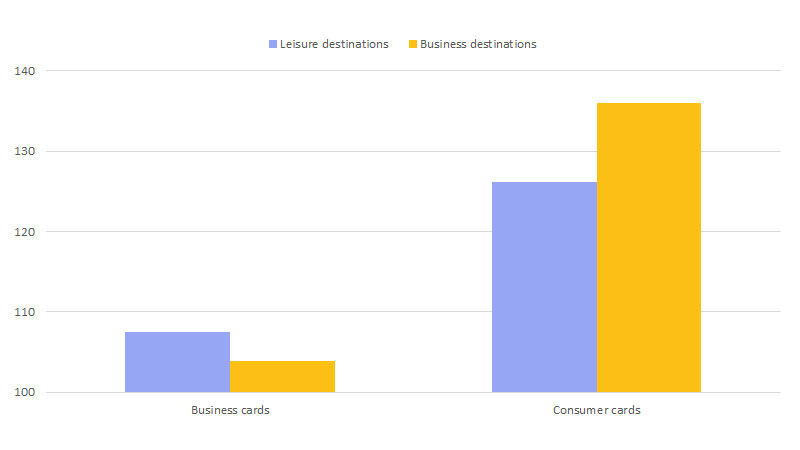
Cross-border summer travel bar graph. See image description for details.

Bar chart showing cross-border summer travel to top 700 cities, excluding Asia Pacific. Indexed to 100 in 2019, business cards used at leisure destinations had an index of 107.4 and those used at business destinations were at 103.9. On the other hand, consumer cards performed much better at leisure destinations having an index of 126.1 and even more so at business destinations  with an index of 135.9.

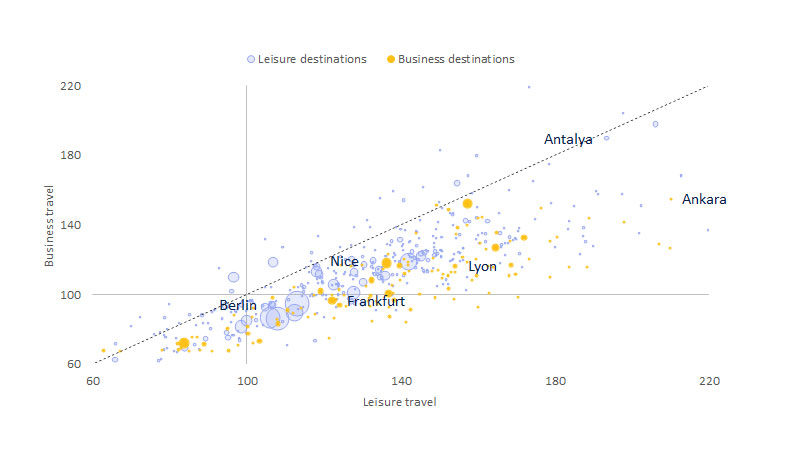
Cross-border summer travel scatter graph. See image description for details.

Scatter chart comparing recovery of business versus leisure destinations. Business destinations recovered more than leisure destinations because of leisure travelers visiting more business destinations than leisure destinations.