Travel insights Cross-border tourism in Asia is taking off
June 6, 2018 - Cross-border tourism from Asia Pacific (AP) is booming—outpacing income growth (real GDP) in the region. AP households now account for one in three global traveling households, up from one out of four in 2006.1 Growth could accelerate even faster as more AP households in more cities cross the tipping point into the ranks of the global traveling class, adding an estimated nearly 90 mil. households by 2025.2 The Asian traveling class will not arrive en masse over a single time frame, but rather over many years, if not decades. As more and more AP households enter the traveling class and begin exploring beyond their national borders, new opportunities—and challenges—will arise for tourism and travel providers.
Currently, AP residents are traveling mostly within the region, but this will change as incomes and affluence grow in these rapidly developing economies. In addition, if the development of AP outbound travel matches that of more established markets, the choice of destinations could expand as the share of long-haul trips grows. Where these travelers go may also forge new travel patterns that are unlike those of the more mature markets—opening up new areas for exploration and discovery.
Asian tourism travel is growing faster than income growth
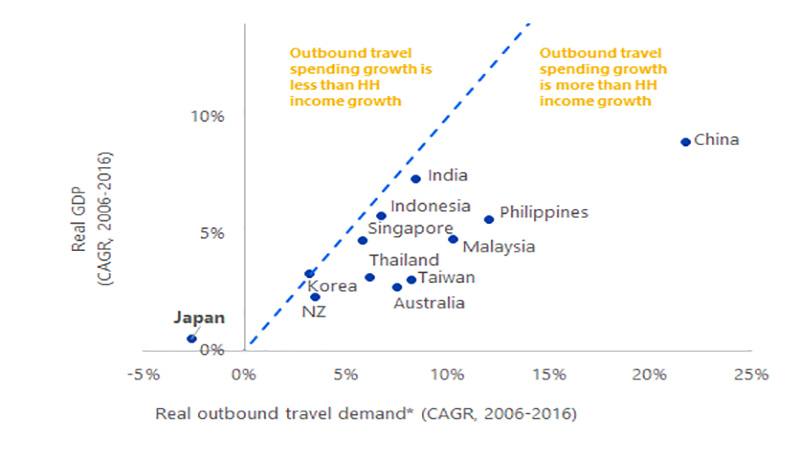
Outbound travel demand is outpacing income growth throughout much of the AP. Measured by travelers’ spending abroad,* demand in 12 of the major AP economies has grown on average twice as fast in constant dollars and prices over the last decade as real economic growth, which is often viewed as a proxy for income growth.
Outbound travel demand in China, the regional leader, rose 22 percent per year from 2006 to 2016, compared with only 9 percent per year growth in real GDP. Trends in outbound travel from Southeast Asia are also encouraging, with growth in outbound travel significantly exceeding real economic growth in the Philippines, Malaysia and Thailand.
One exception to the trend is Japan, where cross-border travel is slowing. The fall in Japan’s overseas travel likely reflects the dynamics of an older population preferring to travel domestically. It could also be the relatively slower pace of both economic and income growth in Japan compared to the rest of Asia.
Travel and tourism expenditures* are growing faster than GDP in all major Asian economies except Japan

* Travel services imports in USD deflated using origin markets’ real effective exchange rates
Sources: International Monetary Fund, Institute of International Finance, Haver Analytics, Visa Business and Economic Insights
AP markets are reaching a tipping point in cross-border travel
Given the dynamics around international travel, AP travel could accelerate even faster than its current pace as more cities reach the necessary size to support mass tourism.
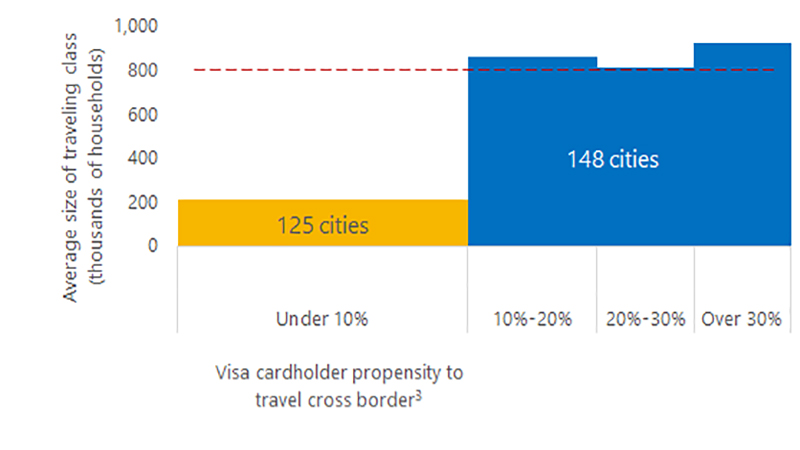
The propensity of households to travel cross-border ramps up once traveling-class households reach a critical mass of around 800,000 (roughly 70 percent of total resident households), according to an analysis of more than 250 cities around the world.3 This could be due to a threshold effect, such as airlines starting to add direct routes when there are enough travelers to fill long-haul planes.
As the level of affluence rises in Asia, more and more of its cities will likely grow in importance for outbound cross border tourism. In China alone, the number of cities reaching the tipping point in cross-border tourism is likely to double by 2025—adding around 80 million more households to the global traveling class.
Cross-border travel accelerates when cities reach a tipping point of 800,000 traveling class households3

* Bar width is proportional to the number of cities in each category. Traveling class HH are defined as earning more than $20,000/year in constant 2015 USD. A proxy was used for the overall likelihood that HH in a city would travel cross-border (share of Visa cards used in a foreign country relative to the total number of active cards).
Source: VisaNet, VISIT Cities, Oxford Economics, Global Cities, 2017
Travelers venture out more as affluence rises
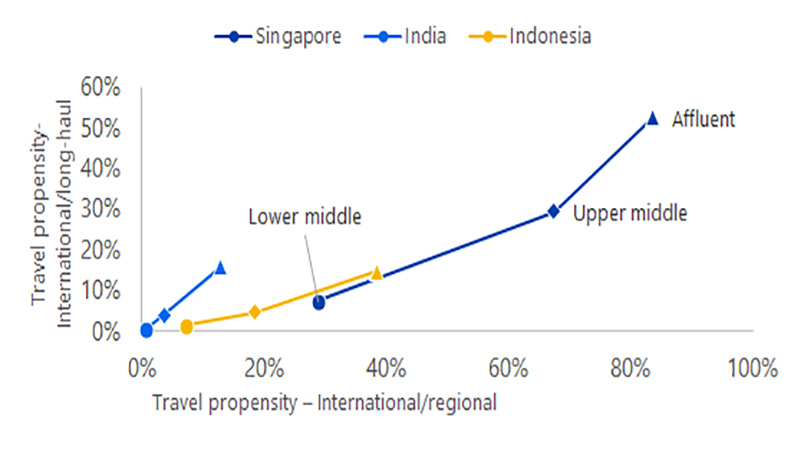
Currently, all income segments in the Asia Pacific skew more heavily to short-haul, regional cross-border travel. Not surprisingly, however, affluence does make a difference in cross-border travel propensity.
Not only do the affluent have a higher propensity overall to travel than the non-affluent, they also tend to take long haul trips to destinations such as the U.S. and Europe.
Singapore (with an average household disposable income of nearly $137,000) has the highest long-haul travel propensity in the AP—50 percent+ among the affluent—followed by Hong Kong ($102,000) and Australia ($85,900). Long-haul travel is virtually non-existent and regional travel is light among lower-income segments in countries such as Japan ($56,000), India ($28,300) and Indonesia ($35,000). In these markets, regional travel increases with income growth and is highest in Indonesia (nearly 40 percent among the affluent).
Cross-border travel increases with income but skews to regional at early stages of traveling class

Source: VisaNet, 2017
Emerging Asia Pacific travelers could blaze their own trails
As the AP traveling class expands, its explorations abroad may not necessarily match the travel patterns set in more established markets. Consider two neighboring countries: Indonesia—a frontier market for global cross-border travel, and Singapore—a more established peer.
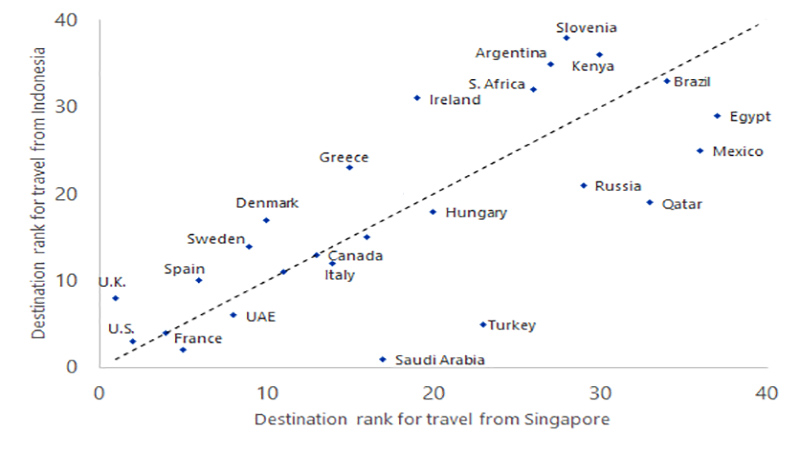
Travel arrivals indicate a preference for European destinations among Singaporean travelers, while Indonesians—who are newer to international travel—appear to favor Middle Eastern countries, according to Visa International Travel (VISIT) data. In fact, the most popular out-of-region destination for Indonesian travelers was Saudi Arabia, which ranked only 17th for Singaporeans. Indonesian and Singaporean traveler preferences coincided in only three out of 40 top long-haul destination countries ranked.
Similarly, according to a recent Visa survey,4 Indonesians noted ‘rich culture and heritage’ as the second most important reason for choosing their last international travel destination, while culture and heritage ranked a distant fifth for Singaporeans.
Neighbor countries can have very different travel preferences; Middle East destinations rank much higher for Indonesian travelers than Singaporeans

* Countries closer to the 45 degree line (chart right) indicate a convergence in preferences between Singaporean and Indonesian travelers, while those farther from the line indicate a divergence in relative popularity.
Sources: VISIT, Haver Analytics, 2017
References or Legal Disclaimer
1 Oxford Economics Tourism Economics
2 Visa Business and Economic Insights Global Travel Study conducted with Oxford Economics, June 2016.
3 Visa Business and Economic Insights Global Travel Study conducted with Oxford Economics, June 2016.
4 Visa Travel Intentions Survey, 2017
Methodology
VISIT (Visa International Travel) is a proprietary platform that combines Visa's cardholder data with publicly-available cross-border arrival statistics. The platform provides a comprehensive view into high-frequency cross-border travel flows, currently encompassing the top 82 origin and destination countries, which collectively account for more than 80 percent of global travel. VISIT combines unique counts of Visa cardholders that register a face-to-face transaction at a merchant outside their home country in a given calendar month with other transaction data such as average spend per cardholder, card usage patterns at lodging merchants and others. Visa uses this data to econometrically model official arrival statistics compiled by various government sources and to generate estimates that fill in the large gaps existing in the cross-border travel data.
VISIT Cities, an extension of the VISIT platform, estimates cross-border travel at the city level within select countries: Anguilla, Antigua & Barbuda, Argentina, Australia, Austria, Bahamas, Brazil, Canada, Chile, China, Colombia, Cuba, Cyprus, Dominica, Dominican Republic, Egypt, Finland, France, Germany, Greece, India, Indonesia, Italy, Jamaica, Japan, Mexico, Netherlands, Norway, Peru, Poland, Portugal, Puerto Rico, Russia, Saudi Arabia, South Africa, Spain, St. Kitts & Nevis, St. Lucia, St. Vincent & Grenadines, Sweden, Switzerland, Thailand, Trinidad & Tobago, Turkey, United Arab Emirates, United Kingdom, Uruguay, British Virgin Islands, U.S. Virgin Islands. Visits by city are derived by scaling national numbers using city-level details from VisaNet, such as lodging transaction counts by city and unique cardholder counts at lodging merchants by country.
Disclaimer
Case studies, statistics, research and recommendations are provided "AS IS" and intended for informational purposes only and should not be relied upon for operational, marketing, legal, technical, tax, financial or other advice. You should consult with your legal counsel to determine what laws and regulations may apply to your circumstances. The actual costs, savings and benefits of any recommendations or programs may vary based upon your specific business needs and program requirements. By their nature, recommendations are not guarantees of future performance or results and are subject to risks, uncertainties and assumptions that are difficult to predict or quantify. Visa is not responsible for your use of the information contained herein (including errors, omissions, inaccuracy or non timeliness of any kind) or any assumptions or conclusions you might draw from its use. Visa makes no warranty, express or implied, and explicitly disclaims the warranties of merchantability and fitness for a particular purpose, any warranty of non-infringement of any third party's intellectual property rights. To the extent permitted by applicable law, Visa shall not be liable to a client or any third party for any damages under any theory of law, including, without limitation, any special, consequential, incidental or punitive damages, nor any damages for loss of business profits, business interruption, loss of business information, or other monetary loss, even if advised of the possibility of such damages.
All brand names and logos are the property of their respective owners, are used for identification purposes only.