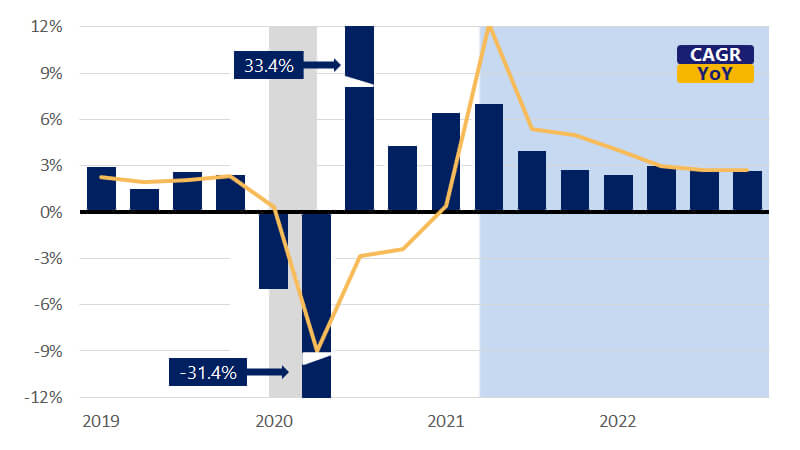
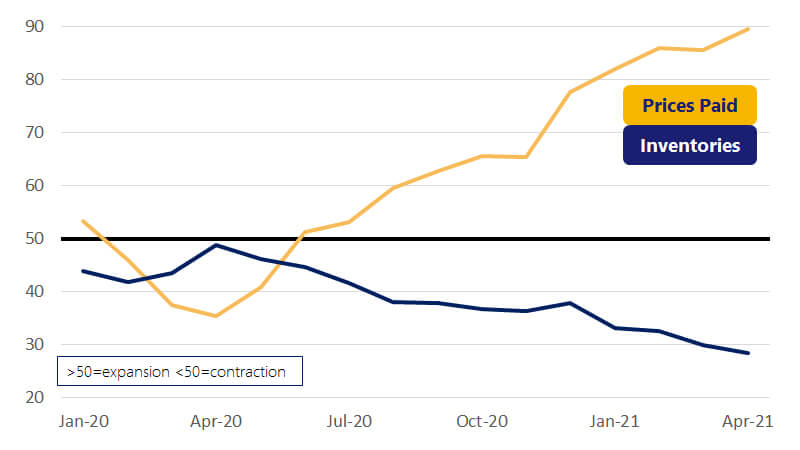
May 25, 2021 – Regular readers will note that we have been pointing out the risk of higher inflation for several months now. Not only do we expect high year-over-year (YoY) readings for inflation due to last year’s low readings, but also greater price pressures as a result of the stimulus-fueled demand combined with global supply constraints. These supply shortages have created a bit of a pothole on the road to recovery, which will likely limit aggregate consumption growth for the next two quarters. April’s Institute for Supply Management (ISM) Manufacturing data underscored the severity of the shortages, with the Consumer’s Inventory Index reaching its lowest reading on record while the Prices Paid (for Inputs) Index reached its highest level since July 2008. Outside of the supply chain issues, we now know the economy expanded at a robust 6.4 percent annualized pace in Q1 and GDP is quickly on its way to fully recovering to pre-pandemic levels by the end of Q2. Job growth in April was disappointing, with 266,000 jobs added for the month. Evidence points to supply chain issues, while chip shortages for auto manufacturers resulted in a decline in jobs in the automobile sector.
In light of the higher price pressures and severity of the supply constraints, we have downwardly revised our outlook for GDP growth this year to 5.6 percent (YoY). The supply and demand imbalance is now expected to limit growth, which is still expected to be above its long-run average in 2022 at 3.1 percent. Key drivers of growth this year will continue to be the robust pace of consumer spending as health-related restrictions are lifted and consumer confidence fully recovers to its pre-pandemic levels.