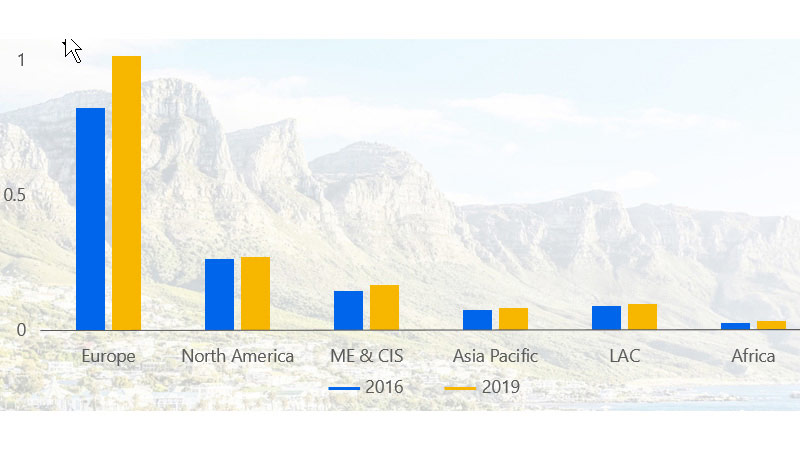
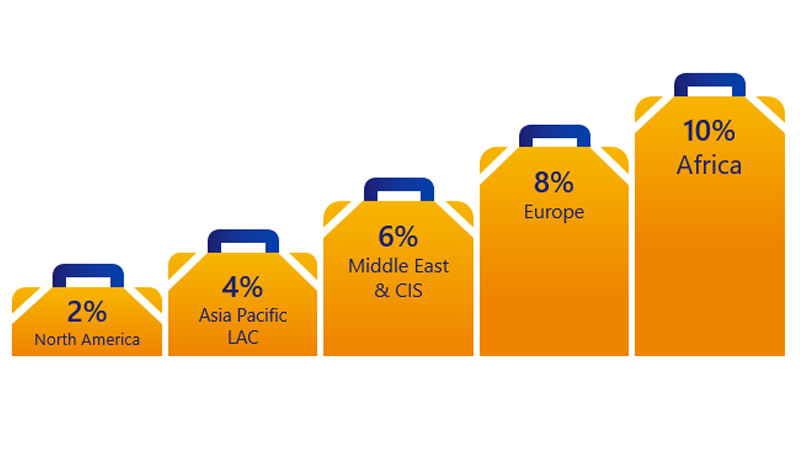
February 4, 2020 – At the current rate of growth in global travel, tourists will take an estimated two billion cross-border trips annually by the end of the decade, an increase of 500 million globally from today’s rate.1 As travel and tourism continues to outpace the global economy,2 many of the world’s emerging markets see the industry as a new growth opportunity and are changing their entry visa policies to attract more visitors. The shift is starting to get results. Following a decade of visa liberalization in Africa, for example, tourist arrivals grew 8 percent year-over-year (YoY) in 2019 to reach an estimated 47 million visitors to the continent last year, according to the Visa International Travel (VISIT) platform, which combines VisaNet data with publicly-available cross-border arrival statistics. That was a new high compared to the previous year’s arrivals in Africa of 43 million in 2018 (up 11 percent YoY) and 39 million (12 percent YoY growth) in 2017.
Relaxing their visa requirements is one way that African countries can overcome some of the challenges they face in attracting tourists—including the vast distances, nascent infrastructure development, infrequent flight schedules and high cost of travel (sometimes, it is cheaper to travel to another continent than to travel within Africa). Addressing these challenges often requires longer-term planning, investment and coordination. In contrast, African countries may be able to take quicker action on their visa policies, with significant upside potential.
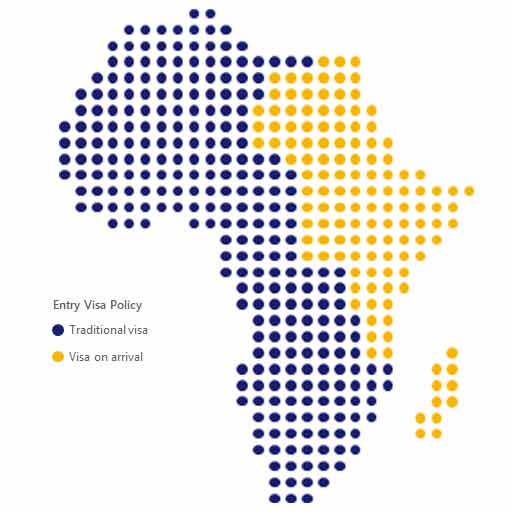
Opening Africa’s borders is in step with a global trend. Traditional paper visas declined 24 percentage points internationally from 2008 to 20183 while the growth of less rigid visa options ticked up—including visas on arrival (up 10 percentage points), visa exemptions (up 4 percentage points) and eVisas (up 10 percentage points). The growth rates were even more noteworthy in Africa, with traditional visas declining 43 percentage points as visas on arrival increased 30 percent and eVisas grew 12 percent. Simplifying the visa process appears to be Africa’s way of saying ‘karibu,’ or welcome, in Swahili to travelers from within the region and abroad.